Automatic Speech Processing Methods For Bioacoustic Signal Analysis:
Automatic Speech Processing Methods For Bioacoustic Signal Analysis: A Case Study Of Cross-Disciplinary Acoustic Research. Mark D. Skowronski and John G. Harris Computational Neuro-Engineering Lab, University of Florida, Gainesville, FL. DETECTION. DETECTION. ABSTRACT

Automatic Speech Processing Methods For Bioacoustic Signal Analysis:
E N D
Presentation Transcript
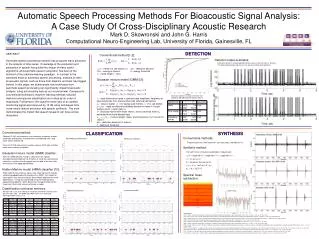
Automatic Speech Processing Methods For Bioacoustic Signal Analysis: A Case Study Of Cross-Disciplinary Acoustic Research Mark D. Skowronski and John G. Harris Computational Neuro-Engineering Lab, University of Florida, Gainesville, FL DETECTION DETECTION ABSTRACT Automatic speech processing research has produced many advances in the analysis of time series. Knowledge of the production and perception of speech has guided the design of many useful algorithms, and automatic speech recognition has been at the forefront of the machine learning paradigm. In contrast to the advances made in automatic speech processing, analysis of other bioacoustic signals, such as those from dolphins and bats, has lagged behind. In this paper, we demonstrate how techniques from automatic speech processing can significantly impact bioacoustic analysis, using echolocating bats as our model animal. Compared to conventional techniques, machine learning methods reduced detection and species classification error rates by an order of magnitude. Furthermore, the signal-to-noise ratio of an audible monitoring signal was improved by 12 dB using techniques from noise-robust feature extraction and speech synthesis. The work demonstrates the impact that speech research can have across disciplines. Conventional method [1,2]: Detector output examples: Each gray column is a hand-labeled call from a pass of 25 calls from L. borealis. The black horizontal line represents θ for equal sensitivity and specificity. xk(n) - frame k of raw signal x(n) E(k) - energy in frame k L - frame length (~1ms) d(k) - detection decision θ - energy threshold Gaussian mixture model (GMM) [3]: Confusion matrices at equal sensitivity and specificity:105,090 detection blocks (20 ms) xk - input features for frame k: spectral peak amplitude, frequency at peak amplitude, first- and second-order temporal derivatives ωi - class of signal: i = 1 for background frames, i = 2 for call frames p (xk|ωi) - class-conditional probability density for frame k of input feature vector x given class ωi G - Gaussian kernel with mean vector μ and covariance matrix Σ, estimated from hand-labeled data wi,m, μi,m, Σi,m - mixture weight, mean, and covariance of mth kernel for class ωi d(k) - detection decision for frame k θ - likelihood threshold SYNTHESIS Conventional method: CLASSIFICATION SYNTHESIS CLASSIFICATION Features [2,4-8]: min frequency, max frequency, frequency at peak amplitude, and duration, extracted from hand-labeled calls using noise-robust methods [3]. Classifier [2,7-9]: discriminant function analysis (DFA) with stratified covariance matrices (quadratic) Conventional methods: Pipistrellus bodenheimeri: Molossus molossus: Frequency division, time expansion, zero crossings, heterodyne [11]. Synthetic method: For each frame i of features [amplitude(i), frequency(i)]: Gaussian mixture model (GMM) classifer: Same as GMM detector, except ωi represent each species. Averaged log likelihood over all K frames of a call was calculated for each class, and the classifier output was the label of the class with the maximum averaged log likelihood. Hidden Markov model (HMM) classifier [10]: State model of nonstationary signal, each state represents pseudo-stationary probability density function with a GMM. One model for each species was trained using the Baum-Welch algorithm on hand-labeled calls. Testing was performed using the Viterbi dynamic programming algorithm, which determines the log likelihood of the single most likely state sequence through a model. Spectral mean subtraction: Classification confusion matrices: Lasiurus borealis: Tadarida brasiliensis: Average and st. dev. over 20 trials of randomly selected test and train calls, 50% test, 50% train. The GMM and HMM results were statistically indistinguishable (t-test, p>0.9). BIBLIOGRAPHY [1] M. K. Obrist, “Flexible bat echolocation: the influence of individual, habitat and conspecifics on sonar signal design,” Behav. Ecol. Sociobiol., vol. 36, pp. 207-219, 1995 [2] S. Parsons and G. Jones, “Acoustic identification of twelve species of echolocating bat by discriminant function analysis and artificial neural networks,” J. Exp. Biol., vol. 203, pp. 2641-2656, 2000 [3] M. D. Skowronski and J. G. Harris, “Acoustic detection and classification of microchiroptera using machine learning: lessons learned from automatic speech recognition,” J. Acoust. Soc. Am., 2005, submitted [4] M. B. Fenton and G. P. Bell, “Recognition of species of insectivorous bats by their echolocation calls,” J. Mammal., vol. 62, no. 2, pp. 233-243, May 1981 [5] M. J. O'Farrell, B. W. Miller, and W. L. Gannon, “Qualitative identification of free-flying bats using the Anabat detector,” J. Mammal., vol. 80, no. 1, pp. 11-23, Jan. 1999 [6] M. K. Obrist, “Flexible bat echolocation: the influence of individual, habitat and conspecifics on sonar signal design,” Behav. Ecol. Sociobiol., vol. 36, pp. 207-219, 1995 [7] M. K. Obrist, R. Boesch, and P. F. Fluckiger, “Variability in echolocation call design of 26 Swiss bat species: consequences, limits and options for automated field identification with a synergetic pattern recognition approach,” Mammalia, vol. 68, no. 4, pp. 307-322, Dec. 2004 [8] R. F. Lance, B. Bollich, C. L. Callahan, and P. L. Leberg, “Surveying forest-bat communities with Anabat detectors,” in Bats and Forests Symposium, R. M. R. Barclay and R. M. Brigham, eds., Res. Br., B.C. Min. For., Victoria, B.C., CA, pp. 175-184, 1996 [9] D. Russo and G. Jones, “Identification of twenty-two bat species (Mammalia: Chiroptera) from Italy by analysis of time-expanded recordings of echolocation calls,” J. Zool., Lond., vol. 258, no. 1, pp. 91-103, Sept. 2002 [10] L. R. Rabiner, “A tutorial on hidden Markov models and selected applications in speech recognition,” in Readings in Speech Recognition, A. Waibel and K.-F. Lee, eds., Kaufmann, San Mateo, CA, pp. 267-296, 1990 [11] S. Parsons, A. M. Boonman, and M. K. Obrist, “Advantages and disadvantages of techniques for transforming and analyzing chiropteran echolocation calls,” J. Mammal., vol. 81, no. 4, pp. 927-938, Nov. 2000