Master Excel Formulas & Charts for Effective Data Analysis
Learn IF, AND, OR, NOT functions, nested formulas, dynamic charts, pivot tables in Excel to analyze data efficiently. Understand how to use logical statements and create various chart types for different data representations.

Master Excel Formulas & Charts for Effective Data Analysis
E N D
Presentation Transcript
Using Excel 07, part 2 IF, AND, OR, NOT functions, Nested formulas, Charts, Dynamic charts, Pivot tables
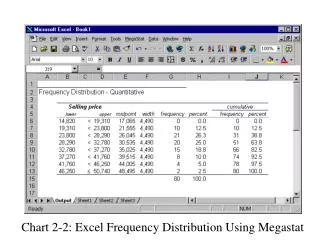
IF Function • Tests a value in a range of cells, performs one action if true, another action if false • =IF(criteria, response if true, response if false) • If sales (F8) are greater than $700 (B4), give them a bonus of 2% of their sales, otherwise “no bonus” • =IF(F8>$B$4,F8*2%,“no bonus") • B4 is an absolute reference, so $B$4 • Use the key F4
AND, OR, NOT Statements • OR = one criteria needs to be met • AND = all criteria need to be met • NOT = reverses the value of the argument • Can be used alone, but more useful with an IF statement
OR Statement • OR(1st criteria, 2nd criteria, etc.) • If sales (F8) are greater than $700 (B4), or went through a training (H8=“Yes”), they get 1.5% of total sales, otherwise “no bonus” • OR(F8>$B$4,H8="Yes") • Nested in an IF statement: • =IF(OR(F8>$B$4,H8="Yes"),F8*1.5%,"no bonus") • Note B4 is absolute reference
AND Statement • AND(1st criteria, 2nd criteria, etc.), • F23 is an added average sales cell • If the employee has above average sales (F8>F23), and went through training (H8=“Yes”), they get a 2.5% bonus (K2) • AND(F8>$F$23,H8="Yes“) • Nested in an IF statement: • =IF(AND(F8>$F$23,H8="Yes"),F8*$K$2,"no bonus") • Note F23 and K2 are absolute references
NOT Statement • NOT(criteria) • If sales (F8) below Sales Goal (B4), training is recommended • NOT(F8>$B$4) • Nested in an IF statement: • IF(NOT(F8>$B$4), “recommended”,””) • Note B4 is an absolute reference • “” means no text returned
Charts • Different charts for different types of data • Bar: comparisons among individual items • Line: trends in data at equal intervals (e.g. – over time) • Pie: data points as a percentage of the whole • Doughnut: pie chart with multiple data series • Scatter: display and compare numeric values (often works best with a trendline) • Bubble: Type of Scatter chart - 3 sets of values, 3rd set displayed as size of bubble • Surface: 3 dimensional surface to represent a set of values
Chart tools contextual tab • Design: Layouts within chart type, color choices • Layout: VERY useful; add titles, data labels, gridlines, 3D rotation, trendlines, error bars • Format: Work with shapes, fill colors, arrangement
Pivot Charts and Tables • Allows you isolate and filter data points on the fly • Insert>Pivot table or pivot chart • You can see more data with a table • Choose data fields with checkmarks • Start with one or two then add • You can drag values into horizontal or vertical axis
Dynamic charts: data • Set up a pulldown list in H3 (Data tab>Data Validation>List) • In H4, put this in: • =IF($H$3=$B$3,B4,IF($H$3=$C$3, C4, IF($H$3=$D$3, D4, IF($H$3=$E$3, E4)))) • Translation: If the pulldown in H3 is set to the column heading in B3, show the results for B4 • Drag the formula down
Dynamic charts: chart • Select a bar chart (Insert tab>Chart) • Pull up Select Data (Design>Select data) • Choose “Edit” in Category • Label range: A4-A13