
Supplemental Figure 1
Supplemental Figure 1. RLU/mg tw. 9. RLU/tissue. 8. **. 7. 6. 5. Luc RLU (log10). ***. ***. 4. 3. 2. 1. 0. Supplemental Figure 2. Mortality Rectal virus shedding Perianal pathology. 100%. 6.0. 5.0. 2×10 6 PFU. 5.0. 80%. 4.0. 2×10 5 PFU. 4.0.

Supplemental Figure 1
E N D
Presentation Transcript
Supplemental Figure 1 RLU/mg tw 9 RLU/tissue 8 ** 7 6 5 Luc RLU (log10) *** *** 4 3 2 1 0
Supplemental Figure 2 Mortality Rectal virus shedding Perianal pathology 100% 6.0 5.0 2×10⁶ PFU 5.0 80% 4.0 2×10⁵ PFU 4.0 60% 3.0 Mortality 3.0 Total PFU/sample 2×10⁴ PFU Pathology Score 40% 2.0 2.0 2×10³ PFU 20% 1.0 1.0 2×10² PFU 0% 0.0 0.0 0 10 20 30 40 50 1 2 3 4 5 6 7 1 2 3 4 5 6 7 8 9
Supplemental Figure 3 Unprotected Protected after AdgB ICR
Supplemental Figure 4 Perianal pathology Mortality 100 5 WT 80 4 CD8-/- 60 3 IFN--/- Mortality (%) Pathology score 40 2 IL-12-/- 20 1 0 0 0 1 2 3 4 5 6 7 0 10 20 30 40 50
a b Supplemental Figure 5 Perianal pathology Rectal virus shedding Mortality *** 100% 5.0 *** 5 *** *** 80% 4.0 *** 4 60% 3.0 *** 3 ** Pathology score Mortality Total PFU/sample 40% 2.0 2 20% 1 1.0 0 0% 0.0 1 2 3 4 5 6 7 0 10 20 30 40 50 7 Perineal pathology Vaginal virus shedding Mortality *** 100% *** 5.0 5 *** * 80% 4.0 4 *** *** 60% *** 3.0 3 Mortality Pathology score Total PFU/sample 40% 2 2.0 20% 1 1.0 0 0% 0.0 1 2 3 4 5 6 7 7 0 10 20 30 40 50 Unimmunized AdgB IN/IN AdgB ICR/IN
a b Supplemental Figure 6 Perianal pathology Mortality 100 5 80 Unimmunized 4 60 AdgB IVAG (Depo) 3 Mortality (%) Pathology score 40 AdgB IVAG 2 20 1 0 0 0 1 2 3 4 5 6 7 0 10 20 30 40 50 Perianal pathology Mortality 100 5 80 Unimmunized 4 60 AdgB IVAG (Depo) 3 Mortality (%) Pathology score 40 AdgB IVAG 2 20 1 0 0 0 10 20 30 40 50 0 1 2 3 4 5 6 7
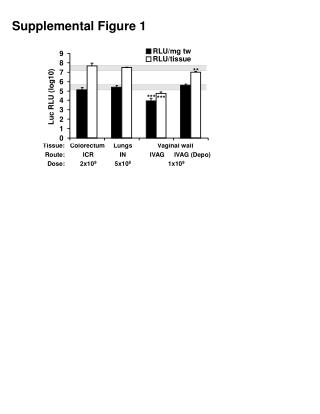
Supplemental Figure 1 Local gene transfer by different mucosal routes. At two days after AdLuc administration via ICR, IN and IVAG (with or without prior Depo-Provera treatment), luciferase activities were determined by measuring luminescence in each corresponding tissue as RLU per tw (density) or whole organ tissue (total mass). At specified doses used for immune function studies, there was no statistical difference in the density or total mass of gene expression among different locations (P > 0.05) except for the vaginal tissue after IVAG without Depo-Provera and the mass after IVAG with Depo-Provera. Averaged density of gene expression in the colorectum did not exceed that in the lung or vaginal tract. The values are the mean ±s.d. of 3 mice in each group. Asterisks indicate significantly lower RLU compared to other groups. Supplemental Figure 2 Perianal inflammation (pathology) and hindlimb paralysis developed in the HSV-2 rectal challenge model. Doses of HSV-2 for rectal challenge were titrated (N=10/group except for the groups of 2x10² and 2x10³, N=5). The absolute lethal dose (LD100) of HSV-2 was determined as 1x10⁵ PFU, at and above which animals developed 100% hindlimb paralysis (left panel; 100% mortality) and the disease never resolved. Similar to vaginal HSV-2 infection (76;80), rectally infected mice having received LD doses displayed uncontrolled virus replication (middle panel; relatively constant from day 1 till death, with a tendency to increase at day 2-3), increasingly severe perianal inflammation and ulcerative lesions (right panel), and paralysis of hindlimbs developed within 7-10 days.
Supplemental Figure 3 Protection from HSV-2 rectal challenge in mice immunized ICR with AdgB. Left panel: at day 7 after rectal challenge of 2x10⁵ PFU of HSV-2, unimmunized mice developed the disease, severe perianal lesion (white arrow) and paralyzed hindlimb (black arrow). Right panel: in contrast, AdgB ICR immunized mice survived with diminished pathology and the disease was completely resolved by day 7 (no lesion or paralysis developed). Supplemental Figure 4 Protection at the large intestinal mucosa against HSV-2 depends on cellular immunity. Fourteen days after AdgB ICR immunization of gene knockout mice as indicated, mice were challenged rectally with 2x10⁵ PFU of HSV-2. Pathology score (left panel) and mortality (right panel) were measured. At least 5 mice in each group. Supplemental Figure 5 Mucosal prime/boost vaccination requires large intestine immunization to induce full protection against herpes infection. Intranasal prime/boost (IN/IN) is often used to enhance mucosal immune responses. This regimen was compared with priming/boosting of mice by ICR/IN with a 2-week interval. Two weeks after the boost, animals were challenged with HSV-2 at a dose of 2x10⁶ PFU at colorectal mucosa (a) or 2x10⁵ PFU at vaginal mucosa (b) (N=5/group). Parianal pathology (left panels), virus shedding (middle panels) and mortality (right panels) were compared. Asterisks in left panels and right panels indicate a statistical difference of the group in comparison with ICR/IN group.
Although IN/IN was statistically different from unimmunized in pathology (left panel, p<0.05) and mortality (right panel, p<0.01), ICR/IN provided more potent mucosal protection than IN/IN. *, ** and *** indicate p<0.05, 0.01 and 0.001, respectively. Supplemental Figure 6 IVAG immunization fails to protect from HSV-2 challenge. Mice were immunized IVAG with 1x10⁹ PFU of AdgB with or without prior Depo-Provera (33) and 3 weeks later challenged with 2x10⁵ PFU of HSV-2 at either vaginal (a) or colorectal mucosa (b). Pathology (left panels) and mortality (right panels) were examined. N=5/group. No protection was seen after IVAG immunization.


