Analyzing Crash Dumps: Techniques and Tools for Engineers
Discover how to effectively analyze crash dumps for troubleshooting issues in Windows systems. This blog post discusses common scenarios, such as machine crashes and performance issues, and provides a comprehensive overview of tools and methodologies to address them. Learn about the importance of post-mortem analysis, generating memory dumps, and using Sysinternals tools. We also cover advanced debugging techniques, including leveraging Volatility for deep dives into system behavior. Get insights on improving system stability and performance through effective dump analysis.

Analyzing Crash Dumps: Techniques and Tools for Engineers
E N D
Presentation Transcript
PRODUCTION DUMP ANALYZE Dinor Geler SUPPORT ESCALATION ENGINEER GBS. Blog : http://www.thegbsguy.com/ twit me at @DinorGeler linkedinhttp://www.linkedin.com/pub/dinor-geler/26/322/737
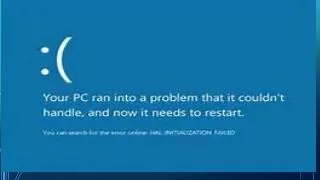
WHY EVEN TAKE A DUMP ? • Machine Crashed – Main Reason. • Performance Issue – Sluggish Machine. • Malware Phorensics. • See What Happened Post Mortem. • Debug A Process Crash Or Hang. • Get Deeper Into Windows Structures.
First thing first before you start I recommended….. • Take A Deeper Look on Sysinternal 5th-6th Book • CodeMachineWebsite http://www.codemachine.com/ • Msdn Is Your Friend http://msdn.microsoft.com/en-US/ • Try To Work on Your Own Use Not My Fault http://download.sysinternals.com/files/NotMyFault.zip • Experience….. Experience…….
SO HOW DO I TAKE A DUMP QUICK OVERVIEW… • http://support.microsoft.com/kb/969028 - How to generate a kernel or a complete memory Dump • http://support.microsoft.com/kb/927069 - kernel crash dump file by using an NMI • http://kb.vmware.com/selfservice/microsites/search.do?language=en_US&cmd=displayKC&externalId=1009187 -Generating a Windows core dump to troubleshoot unresponsive virtual machines on ESX/ESXi
Close environments/secure • If you have secure place and you need to get the symbols you can use the symchk command line,which comes with the windbg. • symchk.exe /r /id f:\Demo\MEMORY.DMP /s http://msdl.microsoft.com/downloads/symbols /om f:\Demo\manifest.txt • Than take the manifest to another env and download the symbols • symchk.exe /r /im f:\Demo\manifest.txt /s http://msdl.microsoft.com/downloads/symbols
Lets dive in …….. • What Info Can I Find From A Dump (Kernel/Full).
Demo - 1 • Customer complains That IE hang on Ghosting (white screen).
DEMO 2 • My Server BSOD : • CRITICAL_OBJECT_TERMINATION
Debug Live Machine using KD • http://msdn.microsoft.com/en-us/library/windows/hardware/ff552017(v=vs.85).aspx • DEMO
How other providers do it …… • Google uses Volatility – lets have a look • https://code.google.com/p/volatility/

