Download

1 / 41
440 likes | 2.32k Vues
Financial Forecasting and Short-term Financing Forecasting and Pro Forma Analysis Timing of financial needs Amount of financial needs Flow of funds Check the covenants Pro forma Income Statement Pro forma Balance Sheet Plug Figure Financing Options Depreciation

E N D
Forecasting and Pro Forma Analysis • Timing of financial needs • Amount of financial needs • Flow of funds • Check the covenants
Pro forma Income Statement Pro forma Balance Sheet Plug Figure Financing Options Depreciation Change in Net Plant & Equipment Capital Expenditures Short-Term Debt Long-Term Debt Working Capital Accounts Sales Forecast External Financing Required Net Income Change in Retained Earnings Dividend Policy
Steps in Financial Forecasting • Forecast sales • Project the assets needed to support sales • Project internally generated funds • Project outside funds needed • Decide how to raise funds • See effects of plan on ratios and stock price
Sales Forecast • Seasonal changes • Business cycle • Recession • Expansion • Market segment • High growth • Contraction • Inflation
AFN (Additional Funds Needed) Key Assumptions • Operating at full capacity in 2001. • Each type of asset grows proportionally with sales. • Payables and accruals grow proportionally with sales. • 2001 profit margin (2.52%) and payout (30%) will be maintained. • Sales are expected to increase by $500 million. (%ΔS = 25%)
AFN (Additional Funds Needed) • AFN= (A*/S0) ΔS - (L*/S0) ΔS - M(S1)(1 - d) = ($1,000/$2,000)($500) - ($100/$2,000)($500) - 0.0252($2,500)(1 - 0.3) = $180.9 million.
Projecting Pro Forma Statements with the Percent of Sales Method: • Project sales based on forecasted growth rate in sales • Forecast some items as a percent of the forecasted sales • Costs • Cash • Accounts receivable • Items as percent of sales • Inventories • Net fixed assets • Accounts payable and accruals • Choose other items • Debt (which determines interest) • Dividends (which determines retained earnings) • Common stock
2002 1st Pass Balance Sheet (Assets)Forecasted assets are a percent of sales.
What are the additional funds needed (AFN)? • Forecasted total assets = $1,250 • Forecasted total claims = $1,071 • Forecast AFN = $ 179 • NWC must have the assets to make forecasted sales. The balance sheets must balance. So, we must raise $179 externally
How will the AFN be financed? • Additional notes payable= 0.5 ($179) = $89.50 $90. • Additional L-T debt= 0.5 ($179) = $89.50 $89. • But this financing will add 0.08($179) = $14.32 to interest expense, which will lower NI and retained earnings.
Results After the Second Pass • Forecasted assets= $1,250 (no change) • Forecasted claims= $1,244 (higher) • 2nd pass AFN = $ 6 (short) • Cumulative AFN= $179 + $6 = $185. • The $6 shortfall came from the $6 reduction in retained earnings. Additional passes could be made until assets exactly equal claims.
Full Capacity • The equation used to calculate EFN when fixed assets are being utilized at full capacity is given below.
S0 = Current Sales, • S1 = Forecasted Sales = S0(1 + g), • g = the forecasted growth rate is Sales, • A*0 = Assets (at time 0) which vary directly with Sales, • L*0 = Liabilities (at time 0) which vary directly with Sales, • PM = Profit Margin = (Net Income)/(Sales), and • b = Retention Ratio = (Addition to Retained Earnings)/(Net Income).
Full Capacity Example • Given that Fixed Assets are being utilized at full capacity and the forecasted growth rate in Sales is 25%. • Forecasted Sales: S1 = 1200(1 + .25) = $1500
Excess Capacity • If the firm has excess capacity in its Fixed Assets then the Fixed Assets may not have to increase in order to support the forecasted sales level. Moreover, if the Fixed Assets do need to increase in order to support the forecasted sales level, then they will not have to increase by as much as would be required if they were being used at full capacity. • If Forecasted Sales are less than Full Capacity Sales, then fixed assets do not need to increase to support the forecasted sales level. On the other hand, if Forecasted Sales are greater than Full Capacity Sales, then Fixed Assets will have to increase.
Case 1: S1 Less Than SFC • Given that Fixed Assets are currently being utilized at 60% of capacity and the forecasted growth rate in Sales is 25%. • S1 = 1200(1 + .25) = $1500 • SFC = 1200/.60 = $2000 • Forecasted Sales are less than Full Capacity Sales the EFN can be found in one step. Here A*0 is equal to Total Current Assets which equals $1200.
Case 2: S1 Greater Than SFC • When the Forecasted Sales are greater than Full Capacity Sales, EFN can be determined in two steps. The first step, EFN1, finds the EFN needed to get to Full Capacity Sales. The second step, EFN2, finds the additional EFN to get from Full Capacity Sales to the Forecasted Sales. • The total EFN is simply EFN1 plus EFN2.
Excess Capacity Example: S1 > SFC • Given that Fixed Assets are currently being utilized at 90% of capacity and the forecasted growth rate in Sales is 25%. • S1 = 1200(1 + .25) = $1500 • SFC = 1200/.90 = $1333.33
Tracing Cash and Net Working Capital • Current Assets are cash and other assets that are expected to be converted to cash with the year. • Cash • Marketable securities • Accounts receivable • Inventory • Current Liabilities are obligations that are expected to require cash payment within the year. • Accounts payable • Accrued wages • Taxes
Raw material purchased Order Placed Stock Arrives Inventory period Accounts receivable period Cash cycle The Operating Cycle and the Cash Cycle Cash received Finished goods sold Time Accounts payable period Firm receives invoice Cash paid for materials Operating cycle
Operating Cycle, Inventory turnover, and A/R turnover • Inventory turnover = Sales / Average Inventory, or COGS / Average Inventory • [Inventory Conversion = 365 / Inventory turnover] • Accounts Receivable turnover = Sales / AR • [Days A/R outstanding = 360 / Accounts Receivable turnover] • Payable turnover = Purchase (or COGS) / AP • [Days A/P outstanding = 360 / Payable turnover] • Operating Cycle = Inventory Conversion + Days A/R outstanding
Accounts payable period Cash cycle = Operating cycle – The Operating Cycle and the Cash Cycle • In practice, the inventory period, the accounts receivable period, and the accounts payable period are measured by days in inventory, days in receivables and days in payables.
Dell’s Working Capital Policy • Dell’s daily sales was about $20M per day. Dell was able to reduce the need of short term financing $800M. Assuming a 6% short term cost of capital, Dell was able to created $48M more pre tax earnings.
You find the following information from a firm’s financial statements, please calculate its cash (conversion) period? • Beginning Inventory $ 400,000 • Purchase $2,600,000 • Ending Inventory $ 600,000 • Accounts Receivable $ 800,000 • Sales $3,600,000 • Accounts Payable $ 600,000
Operating Cycle = Inventory Conversion + A/R Days Cash Cycle = Operating cycle – A/P days Operating Cycle = 75 + 80 = 155 days Cash Cycle = 155 days – 83 days = 72 days
Short term financing: • Advantages: • Could be obtained quicker. • The amount raised can be flexible. • Usually cheaper. (comparing with long-term finance) • Disadvantages • High solvency risk: need to be repaid in a short period. • High refinance risk: face highly volatile short-term interest rates.
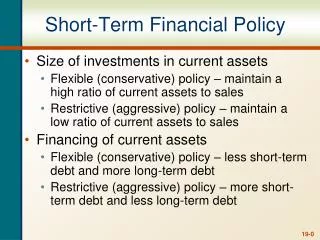
Short-term financing strategies • Moderate Approach: matching maturities. Finance long term assets and permanent current assets with long term financing; finance transitory current assets with short term. • Aggressive Approach: Finance part of permanent assets and all transitory assets with short term financing. • Conservative Approach: Finance part of transitory current assets with long-term financing.
The Short-Term Financial Plan • The most common way to finance a temporary cash deficit to arrange a short-term loan. • Unsecured Loans • Line of credit down at the bank • Secured Loans • Accounts receivable financing can be either assigned or factored. • Inventory loans use inventory as collateral. • Other Sources • Banker’s acceptances • Commercial paper.