Download
1 / 55
560 likes | 643 Vues
Learn about different types of membrane proteins, methods for determining their structure, and binding characteristics of proteins with ligands. Understand the concept of cooperativity in protein-ligand interactions. Discover how oxygen binding curves of Myoglobin and Hemoglobin reflect their distinct functions.

E N D
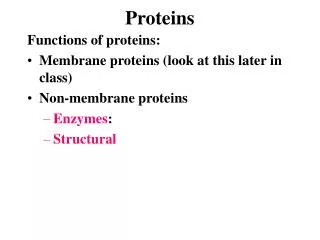
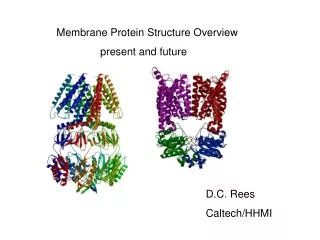
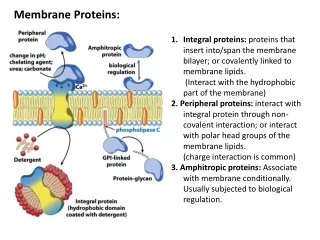
Membrane Proteins: • Integral proteins: proteins that insert into/span the membrane bilayer; or covalently linked to membrane lipids. • (Interact with the hydrophobic part of the membrane) • 2.Peripheral proteins: interact with integral protein through non-covalent interaction; or interact with polar head groups of the membrane lipids. • (charge interaction is common) • 3.Amphitropic proteins: Associate with membrane conditionally. Usually subjected to biological regulation.
A protein’s surface polarity corresponds to its environment Tyr and Trp exhibit ‘snorkeling’ – pointing their polar group toward mb exterior Also, often ‘positive inside’ – positively charged aa’s facing cytoplasmic region
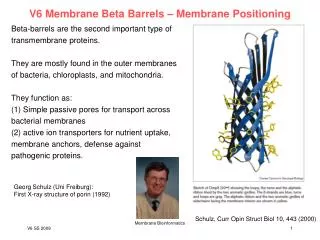
Transmembrane regions are usually α-helices or continuous β-sheets (β-barrels) Backbone hydrogen bonds can be self-satisfied. Porin: a pore-forming protein Bacteriorhodopsin: a light-driven proton pump
Transmembrane helices are predicted by hydrophobic stretches of 20-25 aa residues transmembrane helix
In integral transport proteins, interiors are hydrophilic and exteriors are hydrophobic Glucose transporter Transporter helices have 2-2 pattern: 2 hydrophobic-2 hydrophilic. Since 3.6 a.a/turn, one side of the helix is hydrophobic, the other side is hydrophilic. Transmembrane beta-barrels may have 1-1 pattern: Alternating hydrophobic/hydrophilic a.a. Since R groups of a.a. in beta-sheets facing alternating direction, one side is hydrophobic, the other side is hydrophilic. 4 of its TM helices
Lipid-linked proteins cluster in or outside of rafts based on their linked lipid
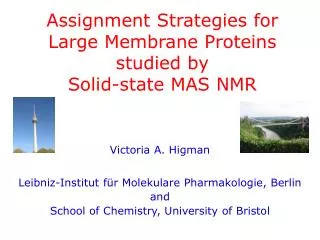
Methods for determining protein structure • Sequence: • Edman degradation: Remove one modified a.a from N-terminus at a time; • Mass spectrometry: Generate small fragments and measure the M/Z ratio. • Secondary structure: • Circular Dichroism • FTIR • Tertiary, quaternary structure: • NMR: derived distance constraints are used to calculate likely protein conformations • X-ray crystallography: Electron density map allows for positioning of protein atoms, revealing structure Indicate the composition of secondary structures
2D NMR separates proton peaks and can reveal approximate distances between nearby atoms a b c d Cross-peaks indicate protons are within 5Å of each other
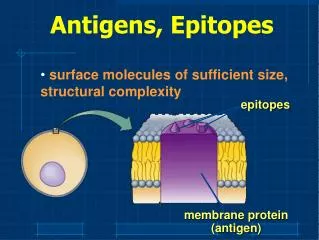
A protein binds a ligand through a specific, reversible interaction binding site Protein-ligand complex Protein Potential ligands: (any atom or molecule, including a protein) OH-N - + + -
The association constant (Ka) and disassociation constant (Kd)provide a measure of affinity between protein & ligand ka P + L PL kd [PL] ka Ka = = kd [P][L] Ka = [PL] = Association Constant [P][L] Kd = 1 = Dissociation Constant Ka
The fraction of occupied binding sites (θ) is proportional to the ligand concentration P + L PL Simple binding: Hyperbolic curve When [L] = Kd, then = 1/2 Lower Kd = Higher Affinity!!
A protein with higher affinity for a ligand has a higher binding curve and lower Kd
Allosteric protein Binding of a ligand (L1) to one site affects binding properties of ligand (L2) at another site (via a conformational change in the protein) . Modulator (L1) is an ‘activator’ if it increases affinity at 2nd site (where L2 binds) Modulator (L1) is an ‘inhibitor’ if it decreases affinity at 2nd site (where L2 binds) Heterotropic interaction:Modulator and other ligand are different L L L L L2 L2 Homotropic interaction (cooperativity): Modulator and other ligand are the same L1 L1
The symmetry (concerted) model of cooperativity Subunits can adopt one of two possible conformations: T or R. All subunits must adopt the same conformation (protein is always symmetric). Equilibrium between T and R states is influenced by ligand or modulator binding. The sequential (gradual) model of cooperativity Subunits can adopt multiple conformations; Binding of ligand (S) induces conformational changes in the bound subunit and in neighboring subunits; Bound conformations may have higher or lower affinity for ligand than the free protein.
The oxygen-binding curves of Mb and Hb reflect their different functions Myoglobin: single subunit, high affinity to oxygen, hyperbolic curve. Hemoglobin: 4 subunits, sigmoidal curve, low affinity at tissues, high affinity at lungs. Cooperativitiy.
Heme cofactors bind O2 • Heme is held in place by the proximal His and by hydrophobic residues • Proximal His of Hb covalently binds Fe of heme • Distal His hydrogen bonds to O2 bound to Fe. It reduces the affinity of hemoglobin to the toxic positive modulator CO by forcing CO to adopt an angle.
The proximal His links flattening of the heme to shifting of helix F in the T R transition. Movement of helix F shifts the entire quaternary structure of hemoglobin T-state = deoxygenated, low affinity R-state = oxygenated, high affinity There are also several ion pairs in the T-state that are broken upon transition to the R-state.
Modulators/Effectors of O2 binding • Positive (stabilize R-state) • O2 • CO (competitive inhibitor, P50 = 200x lower than O2 (would be 20,000x lower if distal His were not there) • NO • H2S • Negative (stabilize T-state) • 2,3 BPG • Very negatively charged. Makes ionic interactions with Lys, Arg, His, N-terminus in center of tetramer. Keeps Hb in T-state • In R-state, conformation change closes up this central cavity and BPG cannot bind • At high altitudes, BPG helps transfer more oxygen to the tissues • H+ “Bohr Effect” • Protons help salt bridges of T-state to form • Protons from reaction of carbonic anhydrase: CO2 + H2O HCO3- + H+ • CO2 • Can add to N-terminal residues of Hb subunits to make carbamate (stabilizes T-state) • Enhances reaction of carbonic anhydrase to make H+ • Cl- • Stabilizing “bridging ion” for ion pairs of T-state
High CO2, converting to bicarbonate and proton by Carbonic anhydrase, low pH, high Cl- Low O2 BPG binds to stablize T-state Low CO2, bicarbonate and proton being converted to CO2 by Carbonic anhydrase, high pH, low Cl- High O2 BPG cannot bind to R-state
Enzymes • Do not change the equilibrium state of reactants or products (do not change thermodynamics) • Q = KeqΔG = 0 @equilibrium (remember rxn quotient ,Q = [products]/[reactants]) • Q < KeqΔG < 0 (-) spontaneous in forward direction (less products than @equil) • Q > KeqΔG > 0 (+) spontaneous in reverse direction (more products than @equil) • Enhance the rate (kinetics) of a reaction • Kinetics are determined by the state with the highest EA • Enzymes act by PREFERENTIALLY BINDING the transition state – this lowers the EA catalyze a reaction by lowering the activation energy (EA)
Enzymes use several catalytic mechanisms (often together) to enhance reaction rates • Proximity and orientation effects: the enzyme positions substrates (with respect to each other and to enzyme functional groups) to maximize reactivity • Electrostatic catalysis: the enzyme uses charge-charge interactions in catalysis • Preferential binding of transition state: binding interactions between the enzyme and TS are maximized; they are greater than those in the enzyme-substrate or enzyme-product complexes • General acid and general base catalysis: functional groups of the enzyme donate &/or accept protons • Covalent catalysis: the enzyme forms a covalent bond with the substrate • Metal-ion catalysis: the enzyme uses a metal ion to aid catalysis
Lysozyme mechanism 35 Preferential binding of transition state: carbocation D-sugar is more stable than the original substrate D-sugar in half-chair conformationElectrostatic catalysis: Asp52 Preferential binding of transition state: covalently bound D-sugar is forced into more stable chair conformation • Why SN2? • Carbocation intermediate of SN1 is too unstable • Could not control anomer formed if SN1 is used • Lysozyme always makes beta-anomer(it is a retaining glycosidase) • Crystal structure of lysozyme with transition state analog supports covalent mechanism
Evolution of serine proteases Divergent evolution Convergent evolution
Divergent Enzyme Evolution (Chymotrypsin, trypsin, elastase evolved this way.) Ancestral Protein Diverged through mutations to related sequences. Related Protein 1 Related Protein 2 Related Protein 3 chymotrypsin trypsin elastase Convergent Enzyme Evolution chymotrypsin subtilisin serine carboxypeptidase Unique Protein 1 Unique Protein 2 Unique Protein 3 Converged through mutations to related mechanism. RELATED MECHANISTIC FUNCTION
Serine protease mechanism general acid electrostatic • Hydrolyze peptide bonds using active site Ser, which gets deprotonated by His and nucleophilically attacks the carbonyl carbon general base covalent catalysis proximity and orientation effects preferential binding of transition state • Later on His donates this proton to break the peptide bond (acid catalysis) – C-terminal half of polypeptide leaves with a newly created N-terminus (oxyanion hole) general base • His acts as a base and deprotonates H2O so that water can attack carbonyl and make carboxyl group electrostatic general acid • This proton finally gets transferred back to Ser to release the C-terminus and regenerate the enzyme active site preferential binding of transition state (oxyanion hole)
Chymotrypsin preferentially binds the tetrahedral intermediate
Michaelis-Menten kinetics of enzymes Catalysis(slow) Binding(fast) • v0 is the velocity of the reaction • Units of (concentration of product / time) • KM = KDwhen k2 <<< k-1 • In a reaction with many steps, kcat is the rate constant for the rate-limiting step • kcat is also known as the turnover number and it represents the maximum # of substrate molecules converted to products per active site per unit time • Some of the important assumptions for derivation: • @ time = 0, [P] ≈ 0 • [ES] is constant • @ high [S], v0 = Vmax and [ES] = [ET]
Catalytic perfection • is known as the catalytic efficiency and the upper limit is the rate at which E and S can diffuse together in aqueous solution. • Diffusion-controlled limit is 108-109 M-1s-1. Enzymes in this range have achieved catalytic perfection. When can an enzyme exceed this limit?
More on KM • Difficult to determine Vmax reliably here • KM = [S] when v0 = 0.5Vmax • KM represents the [S] at which half of the enzyme active sites are filled by substrate molecules
Lineweaver-Burk plot • Take the reciprocal of the M-M equation which will yield: • Since this is a linear plot, it relies on the equation for a line, y = mx + b • Where if x=0, then the y-intercept is 1/Vmax • If y=0, then the x-intercept is -1/KM • The slope is KM/Vmax
Enzyme Inhibition – General overview • Described by the following equation: • where • and • and • αKM (also denoted KM’), apparent KM, describes in a way the binding affinity of inhibitor to enzyme • KMapp is the KM observed in the presence of inhibitor For competitive inhibition: For uncompetitive inhibition:
Reversible Inhibitors - Competitive • Competes with substrate for the active site • Can reverse inhibition by adding more substrate • Vmax is unchanged and KM increases with [I] 1/v0 E only increasing[inhibitor] α = 3 α = 2 v0 E + I α = 1 (no inhibitor) 1/[S] [S]
Reversible Inhibitors - Uncompetitive • The inhibitor binds to a site different than the active site and binds only to ES complex • The inhibitor decreases both Vmax and KM • Why does it lower KM? 1/v0 increasing[inhibitor] α = 2 E only α = 1.5 α = 1 (no inhibitor) v0 E + I 1/[S] [S]
Reversible Inhibitors - Mixed • The inhibitor binds to a site other than the active site but can bind to either E or ES • Vmaxdecreases and KM can vary • Noncompetitive inhibition is the special case in which and KM is unchanged (rarely encountered experimentally) 1/v0 α’ < α +inhibitor and -inhibitor lines cross KMapp increases α’ > α lines do not cross KMapp decreases α’ = α lines intersect at x-int KMapp no change increasing+[inhibitor] α' = α α = 1 (-inhibitor) α' > α 1/[S]
Summary of kinetic effects of enzyme inhibition: Lineweaver-Burk plots Competitive inhibition Uncompetitive inhibition 1/v0 1/v0 increasing[inhibitor] α = 2 α = 1.5 increasing[inhibitor] α = 3 α = 1 (no inhibitor) α = 2 α = 1 (no inhibitor) 1/[S] 1/[S] Mixed inhibition 1/v0 α’ < α +inhibitor and -inhibitor lines cross KMapp increases α’ > α lines do not cross KMapp decreases α’ = α lines intersect at x-int KMapp no change increasing+[inhibitor] α' = α α = 1 (-inhibitor) α' > α 1/[S]
b; • c; • a; • d.
Which of the following are reasons why mass spectrometry is a useful tool in protein sequencing?(choose all that apply) a. Sequence identification can be automated; b. It is possible to identify modifications to amino acids; c. A peptide’s sequence can be unambiguously determinded; d. Mass spectrometric sequencing is faster than Edman sequencing; e. The masses of all amino acids are unique. a, b, d
4 3 1 5
Given the enzyme catalyzed reaction: • What assumption must be made about this reaction in order for Km to approach the Kd of the enzyme-substrate complex. • Briefly define ‘first-order’ as it applies to rate constants (15 words or less). • Of the rate-constants above, which are first-order? • Write two different expressions for the Kdof the enzyme substrate complex. • Under what condition is ES at steady state? Write an expression using concentrations and rate constants.
Estimate the Vmax and Km from the following data: • If 0.1μM enzyme was used in each of the above reactions, determine the kcat • What would the catalytic efficiency be?