Merchandise Inventory, Cost of Goods Sold, and Gross Profit
This chapter dives into the essentials of inventory management, cost of goods sold (COGS), and gross profit analysis within financial statements. It explores the income statements and balance sheets of service and merchandising companies, including Century 21 Real Estate and General Motors Corporation. You’ll learn about the cost-of-goods-sold model, inventory accounting systems, and various inventory costing methods like FIFO, LIFO, and weighted average. This comprehensive review sets the foundation for effective financial decision-making in any business.

Merchandise Inventory, Cost of Goods Sold, and Gross Profit
E N D
Presentation Transcript
Merchandise Inventory, Cost of Goods Sold, and Gross Profit Chapter 6
Service Company Century 21 Real Estate Income Statement Year Ended December 31, 20xx Merchandising Company General Motors Corporation Income Statement Year Ended December 31, 20xx Service revenue $XXX Expenses Salary expense X Depreciation expense X Income tax expense X Net income $ X Sales revenue $185 Cost of goods sold 146 Gross profit 39 Operating expenses: Salary expense X Depreciation expense X Income tax expense $ X Net income $ 4 Income Statements
Service Company Century 21 Real Estate Balance Sheet Year Ended December 31, 20xx Merchandising Company General Motors Corporation Balance Sheet Year Ended December 31, 20xx Current assets: Cash $X Short-term investments X Accounts receivable, net X Prepaid expenses X Current assets: Cash $ X Short-term investments X Accounts receivable, net X Inventory 11 Prepaid expenses X Balance Sheets
General Motors Corporation Balance Sheet (partial) General Motors Corporation Income Statement (partial) Current assets: Cash $ XXX Short-term investments XXX Accounts receivable XXX Inventory (1 truck @$15,000) $15,000 Prepaid expenses XXX Sales revenue (2 trucks @ $20,000) $40,000 Cost of goods sold (2 trucks @ $15,000) 30,000 Gross profit $10,000 Accounting for Inventory
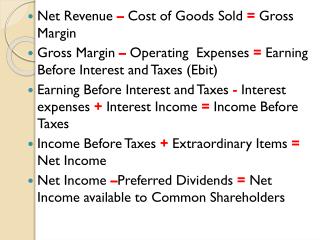
Gross Profit (Gross Margin) Sales revenues – Cost of goods sold = Gross profit (before operating expenses) Gross profit – Operating expenses = Net income
Balance Sheet Cost of inventory on hand = Number of units on hand × unit cost Income Statement Cost of goods sold = Number of units sold × unit cost Computing Cost
Learning Objective 1 Use the cost-of-goods- sold model.
Ending inventory $30 Cost of goods available for sale $120 Cost of goods sold $90 Cost of Goods Sold Model Beginning inventory $20 Purchases $100
How Much InventoryShould Be Purchased? Budgeted cost of goods sold $6,000 + Budgeted ending inventory 1,500 = Budgeted cost of goods available for sale $7,500 – Actual beginning inventory 1,200 = Budgeted purchases $6,300
Learning Objective 2 Account for inventory transactions.
Inventory Accounting Systems Periodic systems do not keep a continuous record of inventory on hand. Perpetual systems maintain a running record to show the inventory on hand at all times.
Recording Transactionsin the Perpetual System Debit Inventory Credit Cash or Accounts Payable Debit Cash or Accounts Receivable Credit Sales Revenue Debit Cost of Goods Sold Credit Inventory
Recording Transactionsin the Perpetual System Purchase price of the inventory $600,000 + Freight-in 4,000 – Purchase returns – 25,000 – Purchase allowances – 5,000 – Purchase discounts – 14,000 = Net purchases of inventory $560,000
Inventory Accounts Payable Beg. 100,000 560,000 560,000 Recording Transactionsand the T-Accounts Inventory 560,000 Accounts Payable 560,000 Purchased inventory on account
Recording Transactionsand the T-Accounts Sale on account $900,000 (cost $540,000): Accounts Receivable 900,000 Sales Revenue 900,000 Cost of Goods Sold 540,000 Inventory 540,000
Cost of Goods Sold 540,000 Recording Transactionsand the T-Accounts Inventory Beg. 100,000 560,000 120,000 540,000
Reporting in theFinancial Statements Income Statement (partial) Sales revenue $900,000 Cost of goodssold 540,000 Gross profit $360,000 Ending Balance Sheet (partial) Current assets: Cash $ XXX Short-term investments XXX Accounts receivable, net XXX Inventory 120,000 Prepaid expenses XXX
Reporting in theFinancial Statements Net purchases = Purchases + Freight-in – Purchase returns & allowances – Purchases discount Net sales = Sales revenue – Sales returns & allowances – Sales discounts
Learning Objective 3 Analyze the various inventory methods.
Specific unit cost Weighted-average cost First-in, first-out (FIFO) Last-in, first-out (LIFO) What Goes Into Inventory Cost? The cost of any asset, such as inventory, is the sum of all the costs incurred to bring the asset to its intended use. Generally accepted inventory costing methods:
Illustrative Data Beginning inventory (10 units @ $10) $100 No. 1 (25 units @ $14 per unit) $350 No. 2 (25 units @ $18 per unit 450 Total purchases 800 Cost of goods available for sale $900 Ending inventory: 20 units Cost of goods sold: 40 units
Specific Unit Cost 5 Units @ $10 Cost of Goods Sold $ 50 350 180 $580 25 Units @ $14 10 Units @ $18 $900 – $580 = $320
Weighted-Average $900 total cost ÷ 60 units = $15/unit Ending inventory = 20 × $15 = $300 Cost of goods sold = 40 × $15 = $600
First-In, First-Out Ending inventory cost 60 units Less units sold 40 Ending inventory 20 units 20 units × $18 per unit = $360
First-In, First-Out 10 Units @ $10 Cost of Goods Sold $100 350 90 $540 25 Units @ $14 5 Units @ $18
Last-In, First-Out Ending inventory cost 60 units Less units sold 40 Ending inventory 20 units 10 units × 10 = $100 10 units × 14 = 140 Total $240
Last-In, First-Out Cost of Goods Sold $450 210 $660 25 Units @ $18 15 Units @ $14
Income Effects ofInventory Methods EndingInventory Specific unit cost $320.00 Weighted-average $300.00 FIFO $360.00 LIFO $240.00
Income Effects ofInventory Methods Cost of Goods Sold Specific unit cost $580.00 Weighted-average $600.00 FIFO $540.00 LIFO $660.00
Income Effects ofInventory Methods Assumed Sales Revenue Cost of Goods Sold Gross Profit Specific unit cost $1,000 – 580 = $420 Weighted-average $1,000 – 600 = $400 FIFO $1,000 – 540 = $460 LIFO $1,000 – 660 = $340
Income Effects – InventoryCosts Are Increasing Ending inventory, gross profit, and net income FIFO Weighted- average LIFO
Income Effects – InventoryCosts Are Decreasing Ending inventory, gross profit, and net income LIFO Weighted- average FIFO
Learning Objective 4 Identify the income and the tax effects of the inventory methods.
FIFO LIFO Gross profit $460 $340 Operating expenses 260 260 Income before taxes $200 $ 80 Income tax expense (40%) $ 80 $ 32 The Tax Advantage of LIFO The most attractive feature of LIFO is low income tax payments.
Comparison of Inventory Methods FIFO produces inventory profits during periods of inflation. LIFO allows managers to manipulate net income. LIFO liquidation occurs when inventory quantities fall below the level of the previous period resulting in higher net income and increased taxes.
International Perspective LIFO is not allowed in some countries, e.g., Australia and the U. K. Companies that use LIFO must use another accounting method for their inventories in these foreign countries.
Accounting Principlesand Inventories Consistency Principle Businesses should use the same accounting methods and procedures from one period to the next. A company may change inventory methods, but it must disclose the effects of the change on net income.
Accounting Principlesand Inventories Disclosure Principle The financial statements should report enough information to enable an outsider to make knowledgeable decisions about the company.
Accounting Principlesand Inventories Materiality Concept An item is material if it has the potential to alter a statement user’s decision. Materiality is specific to the entity being evaluated.
Accounting Principlesand Inventories Conservatism Err on the side of caution when reporting any item in the financial statements.
Lower-of-Cost-or-Market Rule Inventory is reported at the lower of its historical cost or market (replacement) value. If the replacement cost falls below its historical cost, the business must write down the value of its inventory.
Show how inventory errors affect cost of goods sold and income. Objective 5
Effects of Inventory Errors An error in the ending inventory creates errors for cost of goods sold and gross profit. The current year’s ending inventory is next year’s beginning inventory.
Effects of Inventory Errors Period 1 Ending Inventory Overstated by $5,000 Period 1 Beginning Inventory Overstated by $5,000 Period 1 Correct Sales revenue Cost of goods sold: Beg. inventory Purchases Cost of goods available for sale Ending inventory Cost of goods sold Gross profit $100,000 $10,000 50,000 $60,000 (15,000) 45,000 $ 55,000 $100,000 $15,000 50,000 $65,000 (10,000) 55,000 $ 45,000 $100,000 $10,000 50,000 $60,000 (10,000) 50,000 $ 50,000
Ethical Considerations Managers of companies whose profits do not meet stockholder expectations are sometimes tempted to “cook the books” to increase reported income. What are some possibilities? 1. Overstating ending inventory 2. Creating fictitious sales revenue
Learning Objective 6 Use the gross profit percentage and inventory turnover to evaluate business.
Using the Financial Statementsfor Decision Making Gross profit percentage = Gross profit ÷ Net sales revenue Inventory turnover = Cost of goods sold ÷ Average inventory
Gross Profit on $1 of Salesfor Two Merchandisers $1.00 — $0.75 — $0.50 — $0.25 — $0.00 Gross profit $0.21 Gross profit $0.61 Cost of goods sold $0.79 Cost of goods sold $0.39 General Motors Pepsi Co.
Beginning inventory + Purchases = Cost of goods available for sale – Ending inventory = Cost of goods sold Estimating Inventory The gross profitmethod of estimating ending inventory is based on the cost-of-goods-sold model.