Download
1 / 40
400 likes | 606 Vues
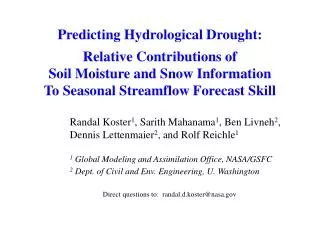
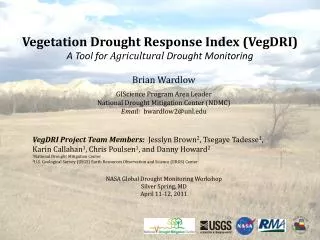
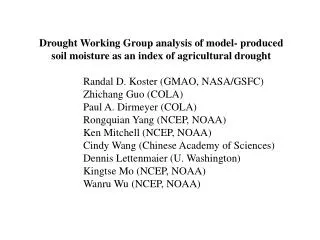
Drought Working Group analysis of model- produced soil moisture as an index of agricultural drought Randal D. Koster (GMAO, NASA/GSFC) Zhichang Guo (COLA) Paul A. Dirmeyer (COLA) Rongquian Yang (NCEP, NOAA) Ken Mitchell (NCEP, NOAA) Cindy Wang (Chinese Academy of Sciences)

E N D
Drought Working Group analysis of model- produced soil moisture as an index of agricultural drought • Randal D. Koster (GMAO, NASA/GSFC) • Zhichang Guo (COLA) • Paul A. Dirmeyer (COLA) • Rongquian Yang (NCEP, NOAA) • Ken Mitchell (NCEP, NOAA) • Cindy Wang (Chinese Academy of Sciences) • Dennis Lettenmaier (U. Washington) • Kingtse Mo (NCEP, NOAA) • Wanru Wu (NCEP, NOAA)
One of the goals of the U.S. CLIVAR drought working group: • Develop a working definition of drought (onset and demise) that is useful to both the prediction/research and applications communities. • In this talk, we focus on “agricultural” drought: deficits in soil water availability for vegetation (e.g., crop) growth. What quantifiable index can we use to characterize agricultural drought?
Some Potential Agricultural Drought Indices Index Strengths Weaknesses Available networks limited in most parts of the world; ‘point’ measurements. In-situ soil moisture measurements Direct quantification of soil moisture.
Some Potential Agricultural Drought Indices Index Strengths Weaknesses Available networks limited in most parts of the world; ‘point’ measurements. In-situ soil moisture measurements Direct quantification of soil moisture. Measures only top several mm (cm) of soil, and not under dense vegetation. Satellite-based soil moisture measurements Global estimates of areally-averaged soil moisture.
Some Potential Agricultural Drought Indices Index Strengths Weaknesses Available networks limited in most parts of the world; ‘point’ measurements. In-situ soil moisture measurements Direct quantification of soil moisture. Measures only top several mm (cm) of soil, and not under dense vegetation. Satellite-based soil moisture measurements Global estimates of areally-averaged soil moisture. An empirical estimate; ignores some aspects of antecedent meteorology. Palmer drought index Global estimates of drought state; long history of use.
Some Potential Agricultural Drought Indices Index Strengths Weaknesses Available networks limited in most parts of the world; ‘point’ measurements. In-situ soil moisture measurements Direct quantification of soil moisture. Measures only top several mm (cm) of soil, and not under dense vegetation. Satellite-based soil moisture measurements Global estimates of areally-averaged soil moisture. An empirical estimate; ignores some aspects of antecedent meteorology. Palmer drought index Global estimates of drought state; long history of use. Not a direct measurement; soil moisture estimates are model-dependent. Model-derived soil moisture Global estimates of areally-averaged soil moisture; reflects all prior meteorology.
Some Potential Agricultural Drought Indices Index Strengths Weaknesses Available networks limited in most parts of the world; ‘point’ measurements. In-situ soil moisture measurements Direct quantification of soil moisture. Measures only top several mm (cm) of soil, and not under dense vegetation. Satellite-based soil moisture measurements Global estimates of areally-averaged soil moisture. • Remainder of talk: examine this weakness. Can we get around it? An empirical estimate; ignores some aspects of antecedent meteorology. Palmer drought index Global estimates of drought state; long history of use. Not a direct measurement; soil moisture estimates are model-dependent. Model-derived soil moisture Global estimates of areally-averaged soil moisture; reflects all prior meteorology.
nd Global Soil Wetness Project • This phase of the project takes advantage of: • The10-year ISLSCP Initiative 2 data set • The ALMA data standards developed in GLASS • The infrastructure developed in the pilot phase of GSWP • GSWP-2 represents an evolution in multi-model large-scale land-surface modeling with the following goals: • Produce state-of-the-art global data sets of soil moisture, surface fluxes, and related hydrologic quantities. • Develop and test in situ and remote sensing validation, calibration, and assimilation techniques over land. • Provide a large-scale validation and quality check of the ISLSCP data sets. • Compare LSSs, and conduct sensitivity analyses of specific parameterizations. www.iges.org/gswp/ gswp@cola.iges.org
nd Global Soil Wetness Project • This phase of the project will take advantage of: • The10-year ISLSCP Initiative 2 data set • The ALMA data standards developed in GLASS • The infrastructure developed in the pilot phase of GSWP • GSWP-2 represents an evolution in multi-model large-scale land-surface modeling with the following goals: • Produce state-of-the-art global data sets of soil moisture, surface fluxes, and related hydrologic quantities. • Develop and test in situ and remote sensing validation, calibration, and assimilation techniques over land. • Provide a large-scale validation and quality check of the ISLSCP data sets. • Compare LSSs, and conduct sensitivity analyses of specific parameterizations. In GSWP-2, a number of land surface models were driven with the same observations-based meteorological forcing. What we will demonstrate here is that the different models produce a similar soil moisture product, when the product is suitably scaled... www.iges.org/gswp/ gswp@cola.iges.org
GSWP-2 Models (as of March 2005) This page shows the international participation in GSWP-2. The models analyzed here are circled. Vertical structure shows soil layers for water (W) and temperature (T), and the maximum number of snow layers (S). Soil data sets are either supplied by GSWP-2 (g) or the model’s default (d). For vegetation distributions, GSWP-2 supplied datasets include IGBP (i) and SiB (s) categories; Sland has dynamic vegetation. Two models have different time steps for energy (E) and soil (S).
Ostensibly, the model-derived soil moistures produced in GSWP (with the same atmospheric forcing) are very different. Southern U.S. Europe Sahara Root zone soil moistures (degrees of saturation) produced by the 7 land surface models at five sites. Sahel Amazon
Such inter-model differences have long been documented in the literature. They reflect a simple and often overlooked fact: • For various reasons, mostly related to model limitations, a land model’s “soil moisture” variable is best interpreted as an “index” of soil moisture state, one that increases as the soil gets wetter and decreases as it gets drier. • In general, a model’s soil moisture should not be considered an absolute quantity that can be compared between models or against direct observations. It’s MODEL DEPENDENT!
Scaling the data, to isolate temporal variability Let w(j,n) = model’s total soil moisture for day j of year n. Define: w(j,n) – mw(j) WI(j,n) = ---------------------------- sw(j) where mw(j) = Mean (over many years) of w on day j. sw(j) = Standard deviation of w on day j.
Note: given the non-Gaussian nature of soil moisture, there are better ways to scale the data, particularly if a long data history is available… CDF matching: map percentiles. For the GSWP2 analysis, with only 10 years of data, we use the simpler “standard normal deviate” approach. The use of the simpler approach can only make things more difficult for us, so if we still succeed…
Raw model soil moistures Scaled model soil moistures Southern U.S. Europe Sahara Sahel Amazon (31-day smoother applied)
0. .05 .10 .15 .20 .25 .30 .35 .40 .45 .50 .55 .60 .65 .70 .75 .80 .85 .90 .95 1.0 Average r2 between models (degree to which the models produce the same soil moisture information, in terms of temporal variability, with no smoothing) Note: When scaling the soil moisture, the seasonal cycle is subtracted out before statistics are computed, making it that much more difficult to get a high r2.
Scaled model soil moistures If an agricultural drought were defined as, say, a soil moisture falling 0.5s below its climatological mean for that time of year, then all of the models would capture the 1988 Midwest drought. Model dependence of soil moisture values may not be such a big issue…
Study #2: Study of North American Drought Lead: U. Washington. Slides adapted from originals by Dennis Lettenmaier and Cindy Wang.
Models • VIC: Variable Infiltration Capacity Model (Liang et al. 1994) • CLM3.5: Community Land Model version 3.5 (Oleson et al. 2007) • NOAH LSM: NCEP, OSU, Air Force, Hydrol. research lab (Mitchell et al. 1994, Chen and Mitchell 1996) • Catchment LSM: NASA/GSFC Global Modeling and Assimilation Office (Koster et al. 2000; Ducharne et al. 2000)
Data • All models driven with observations-based met forcing. Daily precipitation and temperature max-min, other land surface variables (downward solar and longwave radiation, near-surface humidity, and wind) derived via index methods. Methods as described in Maurer et al. (2002). • Period of analysis: 1920-2003 (after 5-year spinup). • Spatial resolution: 0.5 (3322 land grid cells) • Domain: conterminous United States. • Soil and vegetation parameters differ for different models (generally NLDAS), as provided by model developers.
The challenge: Different land schemes have different soil moisture dynamics Model simulated total soil moisture at cell (40.25N, 112.25W)
Solution: Normalized total column soil moisture Recall: there are more valid ways of scaling soil moisture than using standard normal deviates… • For each model, total column soil moisture was expressed as percentiles. • Percentiles were estimated for each model by month, using simulated total column soil moisture for the period 1920-2003. • Percentiles were computed using the Weibull plotting position formula.
Spatial distribution of average (monthly) between-model correlations of soil moisture percentiles
Study #3: Objective Climate Drought Monitoring over the United States Lead: NCEP. Slides adapted from originals by Kingtse Mo and Wanru Wu.
Agricultural drought (SM percentiles, June 2008) EMC/NCEP All models capture the same basic features: – Drought in SE, southern Texas and California. – Wetness in Great Plains. But details differ.
Uncertainties of the NLDAS: Compare VIC and Noah over 1948-2003. Soil moisture percentiles Corr RMS • Differences are regionally dependent • Over the areas east of 90W, differences are small. • Over the areas west of 90W, differences are large. • The RMS error is larger than 25%: the difference between one drought class to another Thanks: Yun Fan and Andy Wood!!
Note similar result from these three studies: Between-model correlations are smallest in driest areas.
Average (monthly) between-model correlations of soil moisture percentiles: U. Washington study r2 values from GSWP2 study correlation values from NCEP EMC study
Key Question: Why is the model-dependence of a soil moisture index larger (and thus the potential usefulness of this index smaller) in drier areas?
One major reason: the potential for correlation is tied to precipitation variance. A larger year-to-year rainfall variability implies a larger year-to-year soil moisture signal that all models can more easily capture. If precipitation variance is small, the model states aren’t controlled as much by a large forcing signal, and differences in model physics manifest themselves more easily. Correlation between models (GSWP2) s2P
A key difference in model physics that can manifest itself in the absence of strong interannual precipitation forcing: the model’s water holding capacity. e-folding time of soil moisture autocorrelation (months) – U. Washington study Soil water holding capacity of six models (cm)
Differences between VIC and Noah(NCEP study) Total SM anomaly percentile for selected River Forecast Center areas Vic(Blue), Noah (black) From 1950-2001 1. For RFCs east of 90-95W, VIC and Noah agree. e.g. the lower Mississippi , Arkansas RFCs. 2. There are large differences over the western region. e. g. the Missouri , Colorado RFCs 3. VIC has more high frequency components than the Noah. 3 month running mean
Another measure of agreement: average standard deviation of soil moisture values between models. (GSWP2 study) Before mapping After mapping
Summary and Discussion • Land surface models use physically-based formulations to integrate (over time) the effects of meteorological forcing on soil moisture. • The models may provide information on soil moisture state for evaluating agricultural drought. But: simulated soil moistures are model-dependent. Nevertheless, we find that, when interpreted in the context of their own climatology, the seemingly different model productsare in fact consistent – they provide largely the same information on the time variability of soil moisture at a point. The model-dependence of a simulated soil moisture product may not greatly limit its use in characterizing agricultural drought.
Summary and Discussion (cont.) This is particularly true over regions with large interannual precipitation variance. The use of a multi-model average of the scaled values could help “average out” any model-specific behavior that does remain after scaling: Scaled model soil moistures Multi-model average A particularly useful index for agricultural drought? Something to consider!