Analyzing Land Use and Cover Change in Guatemala: Spatial and Multi-Level Modeling Perspectives
310 likes | 423 Vues
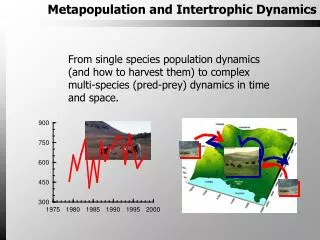
This research explores the complex dynamics of land use and cover change (LUCC) in Guatemala through spatial and multi-level models. It highlights the interplay between human and natural systems, considering both demographic trends such as urbanization and poverty-driven deforestation. The study analyzes data from 2000-2009 on woody vegetation cover and population changes, utilizing various models to assess how factors like rural migration, technological advancements, and agricultural practices influence forest cover. The findings aim to improve understanding of environmental management in tropical regions.

Analyzing Land Use and Cover Change in Guatemala: Spatial and Multi-Level Modeling Perspectives
E N D
Presentation Transcript
Space versus Place in Complex Human-Natural Systems: Spatial and Multi-level Models of Tropical Land Use and Cover Change (LUCC) in GuatemalaDavid López-Carra Jason Davisa, Marta Jankowskab, Laura Grantc, Anna Carla López-Carrb, T Mitchell Aided, Matthew Clarkeea Department of Geography, University of California, Santa Barbara, Human-Environment Dynamics Lab, 4836 Ellison Hall UC Santa Barbara (UCSB)Santa Barbara, CA 93106-4060 b Department of Geography, San Diego State University, 5500 Campanile Drive, San Diego, CA 92182c Department of Economics and Bren School of the Environment, UC Santa Barbara (UCSB)Santa Barbara, CA dDepartment of Biology, University of Puerto Rico, San Juan, PR 00931-3360eDepartment of Geography, Sonoma State University, Stevenson Hall 3066, 1801 E. Cotati Avenue, Rohnert Park, CA 94928American Association for the Advancement of Science (AAAS) Annual Meeting: Mapping and Disentangling Human Decisions In Complex Human-Nature Systems Friday, February 18, 2011: 8:30 AM-11:30 AM140B (Washington Convention Center)
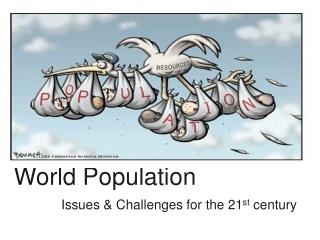
World Population Dynamics - 2 Big Trends: Urbanization & Aging
Increasingly the driver is global urban consumption 2001-2009 163,326 km2 Aide, Clarke, Lopez-Carr, et al. (2010)..
NSF CHH Project: Latin America & Caribbean Demographic dynamics and LUCC Data from FAOSTATS Our analyses Total population change (1990 – 2000) 1990 – 426,465,021 2000 – 503,388,073 diff 76,923,052 Municipality level change # of municipalities: 16,052 # with negative growth : 4,200 % with negative growth: 26.1% Aide, Clarke, Lopez-Carr,, Levy, Grau, et al. (2010). Under review at Science. Global Land Project Open Science Meeting. Arizona State University. 17-19 October.
What municipalities are gaining and losing woody forest cover? Pantanal Mangrove Pampas Aide, Clarke, Grau, Levy, Lopez-Carr, et al. (2010)..
What is the relationship between population change and woody vegetation change? Nada at the municipal level! So what is driving forest conversion?... Aide, Clarke, Lopez-Carr, et al. (2010).
Two Latin Americas: 78% Urban but… • Argentina/Chile/Uruguay – 90% Urban • Guatemala, Ecuador, Bolivia – 50% Urban • And within these countries there is VAST variation • These two Latin Americas are associated with two distinct deforestation Pathways: • Pathway 1: High population growth, rural-rural migration, low technology, low yields, poverty, subsistence. • Pathway 2: Falling population growth, urbanization, increased meat consumption, high yield, increasing affluence, high technology, export agriculture.
Proximate and Underlying Causes Why poverty-driven deforestation WITH rapid urbanization? Disproportionate Scale Problem Macro-Scale demographic, political-economic, social, and ecological dynamics Local Variation Household Responses Fertility regulation Migration Land Management Other response?? Urban or International Destinations Off-farm Labor Rural Destination Agricultural Intensification Agricultural Extensification Return to Top of Chart
Poverty-driven forest conversion tends to target unoccupied forestland, the external frontier. Commercial agriculture often follows land consolidation and thus may or may not be converting old growth forest (internal frontier) • Internal (place) versus external (space) forest frontiers. FARM UNOCCUPIED FOREST forest crops SURROUNDING FARMS
Methods: Data Sources • 2000 Guatemalan Living Standards Measurement Survey • Independent variables: household fertilizer and tractor use • 2003 Guatemala National Agriculture Census • Independent variables: 2003 percent land area in fallow and crop yields for coffee, sugar, white corn, yellow corn • 2001-2009 Forest Cover Change database for all of Latin America (funded by NSF) • Dependent Variables: percent woody cover in 2009 and percent change in woody cover from 2001 to 2009 • Independent variables: 1990 and 2000 population density
Methods: Variables Dependent Variables = woody vegetation in 2009 in model 1, and the percentage change in municipal woody vegetation from year 2001 to 2009
Guatemala LUCC Multilevel Model • i represent municipalities within jth departments • β1 is the intercept along with its independent error term • β2 through βp are regression coefficients with corresponding explanatory variables x2ij through xpij • εij represent an independent error term for x2ij through xpij
Guatemala LUCC GW Model • Y i = woody vegetation in 2009 in model 1, and the percentage change in municipal woody vegetation from year 2000 to 2009 in model 2. • β1 through βk are regression parameter estimates with • corresponding explanatory variables xi1 through xik with independent error term • The weighting function is based on distance, resulting in locations closer to the estimated point having more influence on the projected value than locations farther away.
Guatemala LUCC Multilevel Model Structure (Municipalities within Departments) Forest Cover Population
Results: OLS for Woody Vegetation Change 2001-2009: Intensive: Fertilizer vs Extensive Tractors
Modeling Results: OLS for Woody Vegetation Cover 2009: Frontiervs. Settled and Urban
Results: LUCC Multilevel Model. Woody Cover in 2009 is near PAs and remote areas. Less forest in settled rural areas
Spatial Modeling Results: Moran’s I for Woody Vegetation Change 2001-2009
Figure 1. Getis-Ord Gi* maps for woody vegetation in 2009 and change in woody vegetation 2001-2009 with hot spots in red and cold spots in blue.
Figure 2. Coefficient estimates for percent households using fertilizer for the percent woody cover in 2009 model (left) and percent change in woody cover from 2001 to 2009 model (right).
Figure 4. Coefficient estimates for percent population density change from 1990 to 2000 (left), and percent of land in fallow (right) for the percent woody cover in 2009 model.
Figure 3. Coefficient estimates for percent households owning tractors for the percent woody cover in 2009 model (left) and percent change in woody cover from 20001to 2009 model (right).
Conclusions s • More variation was found internally within model types than between multi-level and spatial models. • However, the interpretation and utility of the results may be notably distinct in a Geographically Weighted Regression (GWR) versus a multi-level model.
Conclusions • Ordinary Least Squares (OLS) regression suggests that population increase and density, agricultural intensification in the form of fertilizers and tractors, and higher crop production for sugar cane and white corn are negatively associated with forest cover in 2009 while coffee production is associated with higher forest cover.
Conclusion • Examining forest change during the first decade of the 2000s for Guatemala, we observe that areas that increasingly relied upon mechanized equipment and/or fertilizers have more thoroughly captured and put into production available agricultural land.
Conclusions • What did GWR and Mlevel regressions tell us beyond these findings? • The multi-level model suggests significant differences exist at the municipal and departmental levels and indicates maintains a positive relationship between coffee production and forest cover at both levels of analysis. • The GWR indicates where these association of changes are most salient. A clear trend emerges: The southwest to northeast gradient of decreasing population density, higher but decreasing forest cover, and lower but increasing technological inputs is particularly illuminated by the GWR.
Conclusions • Why do we care? • Space is important and WHERE things happen is crucial for policy and management. • Coupled human-natural systems take home message: The debate in geography and cognate sciences over the importance of space vs. place is often framed by qualitative vs. quantitative research. It need not be so. Place in coupled human-natural systems can be quantified and measured.