Non-Euclidean Analysis of Blood Vessel Trees: A Manifold Approach
Explore the complex data objects of blood vessel trees in brains using manifold analysis to understand variations in connectivity structure, locations, sizes, and orientations of segments. This interdisciplinary study involves neurosurgery, statistics, and optimization. Dive deep into topology analysis with a focus on back trees, aiming to unravel population variations and structure using appropriate metrics and Fréchet mean calculations. Could PCA techniques be adapted for tree spaces? Follow the exploration of population statistics and mean calculations for tree-structured data objects in a strongly non-Euclidean space.

Non-Euclidean Analysis of Blood Vessel Trees: A Manifold Approach
E N D
Presentation Transcript
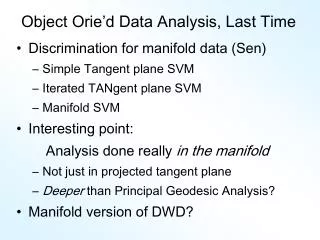
Object Orie’d Data Analysis, Last Time • Discrimination for manifold data (Sen) • Simple Tangent plane SVM • Iterated TANgent plane SVM • Manifold SVM • Interesting point: Analysis done really in the manifold • Not just in projected tangent plane • Deeper than Principal Geodesic Analysis? • Manifold version of DWD?
Mildly Non-Euclidean Spaces Useful View of Manifold Data: Tangent Space Center: Frechét Mean Reason for terminology “mildly non Euclidean”
Strongly Non-Euclidean Spaces Trees as Data Objects From Graph Theory: • Graph is set of nodes and edges • Tree has root and direction Data Objects: set of trees
Strongly Non-Euclidean Spaces Motivating Example: • Blood Vessel Trees in Brains • From Dr. Elizabeth Bullitt • Dept. of Neurosurgery, UNC • Segmented from MRAs • Study population of trees (Forest?)
Blood vessel tree data • Marron’s brain: • MRI view • Single Slice • From 3-d Image
Blood vessel tree data • Marron’s brain: • MRA view • “A” for Angiography” • Finds blood vessels • (show up as white) • Track through 3d
Blood vessel tree data • Marron’s brain: • MRA view • “A” for Angiography” • Finds blood vessels • (show up as white) • Track through 3d
Blood vessel tree data • Marron’s brain: • MRA view • “A” for Angiography” • Finds blood vessels • (show up as white) • Track through 3d
Blood vessel tree data • Marron’s brain: • MRA view • “A” for Angiography” • Finds blood vessels • (show up as white) • Track through 3d
Blood vessel tree data • Marron’s brain: • MRA view • “A” for Angiography” • Finds blood vessels • (show up as white) • Track through 3d
Blood vessel tree data • Marron’s brain: • MRA view • “A” for Angiography” • Finds blood vessels • (show up as white) • Track through 3d
Blood vessel tree data • Marron’s brain: • From MRA • Segment tree • of vessel segments • Using tube tracking • Bullitt and Aylward (2002)
Blood vessel tree data • Marron’s brain: • From MRA • Reconstruct trees • in 3d • Rotate to view
Blood vessel tree data • Marron’s brain: • From MRA • Reconstruct trees • in 3d • Rotate to view
Blood vessel tree data • Marron’s brain: • From MRA • Reconstruct trees • in 3d • Rotate to view
Blood vessel tree data • Marron’s brain: • From MRA • Reconstruct trees • in 3d • Rotate to view
Blood vessel tree data • Marron’s brain: • From MRA • Reconstruct trees • in 3d • Rotate to view
Blood vessel tree data • Marron’s brain: • From MRA • Reconstruct trees • in 3d • Rotate to view
Blood vessel tree data , , ... , Now look over many people (data objects) Structure of population (understand variation?) PCA in strongly non-Euclidean Space???
Blood vessel tree data • The tree team: • Very Interdsciplinary • Neurosurgery: • Bullitt, Ladha • Statistics: • Wang, Marron • Optimization: • Aydin, Pataki
Blood vessel tree data , , ... , • Possible focus of analysis: • Connectivity structure only (topology) • Location, size, orientation of segments • Structure within each vessel segment
Blood vessel tree data • Present Focus: • Topology only • Already challenging • Later address others • Then add attributes • To tree nodes • And extend analysis
Blood vessel tree data • Recall from above: • Marron’s brain: • Focus on back • Connectivity only
Blood vessel tree data • Present Focus: • Topology only • Raw data as trees • Marron’s • reduced tree • Back tree only
Blood vessel tree data Topology only E.g. Back Trees Full Population Study as movie Understand variation?
Strongly Non-Euclidean Spaces Statistics on Population of Tree-Structured Data Objects? • Mean??? • Analog of PCA??? Strongly non-Euclidean, since: • Space of trees not a linear space • Not even approximately linear (no tangent plane)
Mildly Non-Euclidean Spaces Useful View of Manifold Data: Tangent Space Center: Frechét Mean Reason for terminology “mildly non Euclidean”
Strongly Non-Euclidean Spaces Mean of Population of Tree-Structured Data Objects? Natural approach: Fréchet mean Requires a metric (distance) On tree space
Strongly Non-Euclidean Spaces Appropriate metrics on tree space: Wang and Marron (2007) • Depends on: • Tree structure • And nodal attributes • Won’t go further here • But gives appropriate Fréchet mean
Strongly Non-Euclidean Spaces Appropriate metrics on tree space: Wang and Marron (2007) • For topology only (studied here): • Use Hamming Distance • Just number of nodes not in common • Gives appropriate Fréchet mean
Strongly Non-Euclidean Spaces PCA on Tree Space? • Recall Conventional PCA: Directions that explain structure in data • Data are points in point cloud • 1-d and 2-d projections allow insights about population structure
Strongly Non-Euclidean Spaces PCA on Tree Space? Key Ideas: • Replace 1-d subspace that best approximates data • By 1-d representation that best approximates data Wang and Marron (2007) define notion of Treeline (in structure space)
Strongly Non-Euclidean Spaces PCA on Tree Space: Treeline • Best 1-d representation of data Basic idea: • From some starting tree • Grow only in 1 “direction”
Strongly Non-Euclidean Spaces PCA on Tree Space: Treeline • Best 1-d representation of data Problem: Hard to compute • In particular: to solve optimization problem Wang and Marron (2007) • Maximum 4 vessel trees • Hard to tackle serious trees (e.g. blood vessel trees)
Strongly Non-Euclidean Spaces PCA on Tree Space: Treeline Problem: Hard to compute Solution: Burḉu Aydin & Gabor Pataki (linear time algorithm) (based on clever “reformulation” of problem) Description coming in Participant Presentation
PCA for blood vessel tree data • PCA on Tree Space: Treelines • Interesting to compare: • Population of Left Trees • Population of Right Trees • Population of Back Trees • And to study 1st, 2nd, 3rd & 4th treelines
PCA for blood vessel tree data Study “Directions” 1, 2, 3, 4 For sub- populations B, L, R (interpret later)
Strongly Non-Euclidean Spaces PCA on Tree Space: Treeline Next represent data as projections • Define as closest point in tree line (same as Euclidean PCA) • Have corresponding score (length of projection along line) • And analog of residual (distance from data point to projection)
PCA for blood vessel tree data Raw Data & Treelines, PC1, PC2, PC3:
PCA for blood vessel tree data Raw Data & Treelines, PC1, PC2, PC3: Projections, Scores, Residuals
PCA for blood vessel tree data Raw Data & Treelines, PC1, PC2, PC3: Cumulative Scores, Residuals
PCA for blood vessel tree data Now look deeper at “Directions” 1, 2, 3, 4 For sub- populations B, L, R
PCA for blood vessel tree data • Notes on Treeline Directions: • PC1 always to left • BACK has most variation to right (PC2) • LEFT has more varia’n to 2nd level (PC2) • RIGHT has more var’n to 1st level (PC2) • See these in the data?
PCA for blood vessel tree data • Notes: • PC1 - left • BACK - right • LEFT 2nd lev • RIGHT 1st lev • See these??
PCA for blood vessel tree data Individual (each PC separately) Scores Plot
PCA for blood vessel tree data Identify this person