Land Use Planning
990 likes | 1.15k Vues
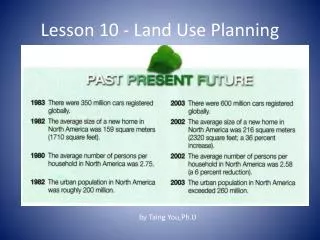
Land Use Planning. Making Physical Connections – Part 1. THE GREAT BARBECUE. THE FIRST STEP IS KNOWING WHERE YOU ARE. AND THEN – THE BASELINES. THE TOWNSHIP AND RANGE SYSTEM. HOW THE SECTIONS ARE ARRANGED. DESCRIBING WITHIN THE SECTIONS. One Section – 640 Acres More Or Less.

Land Use Planning
E N D
Presentation Transcript
Land Use Planning Making Physical Connections – Part 1
DESCRIBING WITHIN THE SECTIONS One Section – 640 Acres More Or Less
Location Exercise Purchaser: BEADLES RICHARD FRecord ID: 424214 Date: 03/24/1862Acres: 80 Price: $11.00 Type of sale: Railroad (RR) County: 41 Section: 8 Section Part: NWNE Township: 01S Range: 01E 3rd Meridian:3 Purchaser Res: Arch. Vol. No: 791 Vol. Page No.: 087 Cash warrant code:Record corrected: 0
WHY IS IT SO IMPORTANT? • Storm Water Discharge Planning • Sewer and Water Installation • Transportation Development • Elevation indicates Soil Type • Soil Type dictates development pattern
THE COOKBOOK MEASURE OF SLOPE Expression of Slope 0 – 3 percent (flat) 3 – 10 percent (moderate) 10 – 15 percent (special caution) 15 – 30 percent (only in California and Colorado) Over 30 percent (heart attack) When slope is expressed as a percent, it is the vertical rise / horizontal run
EXPRESSED AS A RATIO Slope can always be expressed as a ratio by dividing the horizontal run by the vertical rise 1:1 2:1 3:1 5:1 10:1 Vertical Rise Horizontal run
OTHER COOKBOOK FORMULAS FOR LAND USE PLANNING • ½ or less – Nothing feasible • ½ to 1 percent – large scale land uses such as industry, the big box, airports – BUT – major drainage and sewer flow problems • 1 ½ to 5 percent – nearly any land use can be sited • 3 percent is the upper limit for “no problem” heavy truck flow
UPPER SLOPE FORMULA • 5 – 10 percent is generally good for housing development and can be used for smaller scale industry, office and commercial • Many communities will not allow road development over 8 – 10 percent
HIGH SLOPE DEVELOPMENT • 10 – 15% can generally only be used for hillside residential development. Very special practices must be used for road, storm water, and sewer development. All other uses are economically impractical • 15 – 25% is used for very large lot residential development. Extreme costs can be expected
The Inventory • Current Land Data • SIC Codes – 2, 4, 6 digit • Land Based Classification System
SIC Codes • Nine one-digit groups - #3 Trade • 67 two digit groups – Retail> food • 294 three-digit groups • 772 four digit groups • 3457 six digit groups • Auxiliary groups
Example SIC Codes • 0259 - Egg farms – poultry except chicken and turkey • 0279 - Honey Production • 5999 - Hot tubs – retail • 3716 - Recreational Vehicles • 7377 - Computer Rentals • http://www.wave.net/upg/immigration/sic_index.html
Land Based System • Activity Codes • Function Codes • Ownerships Codes • Site Codes • Structure Codes • Classification Data Base
Product – Current Map • The land use • Structure Type • Age of structure • Condition • Conformance
Next Step - Standards • Purpose – To compare our communities land use to current standards • Outcome – To pinpoint deficiencies • Link – To program needs into future land use plan
Journey To Land Use • When you come to a fork in the road – take it • Yogi Bera
Before Going On! • Three Characteristics of Population • Size (basic yardstick for space needs) • Composition (age, household type ..) • Spatial Distribution (where people are located)
Population Terms • Estimate – applies only to a time period between censuses or the current time • Projection – Is a set of methods to determine future population size based on past assumptions • Forecast – Effort to accurately predict a future population point based on modeled assumptions
Population Data • Primary Data – how do you obtain local primary data? • Secondary Data – Census?
Population Standards • Determine growth factors • Project population • Compare rates of growth/decrease with peers • Use comparative models to determine reasons for variance from peers
The Methods • The Big Four Methods • Trend Extrapolation • Ratio/Share • Disaggregate/simulation/component • Symptomatic Association
Trend Extrapolation • Quick – dirty – but generally works in normal populations • Linear Model • Exponential Change – compounding method. Rate of change is constant but the absolute change increases with compounding
Exponentials - Polynomials • Patterns of smaller and smaller incremental growth • Complicated patterns of growth change on regular frequencies • Explosive then incipient growth
Corridor Approach 34,300 ? 32,300 ?
Population Variants – Estimate Projection Intervals • Est. World Pop 1950 – 2,523 • Est. World Pop 1990 – 5,687 • Low Variant 2050 – 7,662 • Medium Variant 2050 – 9,366 • High Variant 2050 – 11,156 Logistic Curve
Ratio- Share • Used only to estimate the ratio of small unit population to a larger/known unit • Extraterritorial areas • CEA units
Disaggregate • Cohort – component method • Components of change methods – Chicago transportation/land model • Vacancy/housing estimate models
Symptomatic Models • A statistical equation is applied to known indicators: • Jobs • Building permits • School Enrollment • Water/power consumption
Population Method Problems • Forecasting when you should be projecting • The long range fairy (25 years) • Very rapid gains • Small area analysis rather than city as a whole • Large area analysis rather than just the reporting district