Download
1 / 32
360 likes | 682 Vues
X-ray Microanalysis. The fluorescent production of X-rays by electrons is one of the most important interactions available in the SEM because it permits chemical (atomic) identification and quantitative analysis to be performed About 60% of all SEMs are now equipped for X-ray microanalysis.

E N D
X-ray Microanalysis • The fluorescent production of X-rays by electrons is one of the most important interactions available in the SEM because it permits chemical (atomic) identification and quantitative analysis to be performed • About 60% of all SEMs are now equipped for X-ray microanalysis
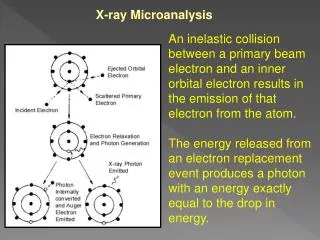
Characteristic X-rays • Characteristic X-rays are formed by ionization of inner shell electrons. The inner shell electron is ejected and an outer shell electron replaces it. The energy difference is released as an X-ray
X-ray peaks • The characteristic X-ray signals appear as peaks (‘lines’) superimposed on the continuum, These peaks have fixed energies
Mosley’s law • Mosley showed that the wavelength of the characteristic X-rays is unique to the atom from which they come • This is the basis of microanalysis
Wavelength and Energy • X-rays can be identified by either their wavelength or by their energy E • These two quantities are related by this relationship, so either can be used
Mosley’s law • K-lines come from 1st shell (1s) • L-lines come from 2nd shell (2s) • M-lines come from 3rd shell (2p) • Each family of lines obeys Mosley’s law
K-lines • K-lines are the easiest to identify and highest in energy • Gaussian shape • K and Kcome together as a pair
L-lines • Often occur in groups of three or four lines so shape can vary • Can overlap K-lines • Important for analysis of elements Z>40 Silver L-line cluster
M-lines • ... and N- and O - lines are very complex • Not all lines are shown on all analyzer systems so check with standards if in doubt • Avoid use if at all possible! However at low energies they must be used. Lead and gold are best analyzed with the M lines
Fluorescent Yield • Not all ionizations produce X-rays • The fractional yield (the fluorescent yield) is called • varies rapidly with atomic number Z and is low for low Z
Measuring X-rays • Wavelength Dispersive Spectrometers measure by diffraction from a crystal. Accurate but slow and low sensitivity • Energy Dispersive Spectrometers measure photon energy. Fast, convenient, good sensitivity but has limitations in energy resolution
The Energy Dispersive Spectrometer • A solid state device - Si(Li) P-I-N diode • Converts X-ray energy to charge. The output voltage step is exactly proportional to the deposited X-ray energy • Measures the photon in about 100microseconds so can process 1000 or more photons/second Window Bias PIN diode Capacitor C Xray generates electron/hole pairs (3.6eV / pair) Voltage=Q/C Charge ~ Xray energy
The EDS detector • The cryostat cools the pre-amp electronics and detector diode • The window protects the detector from the SEM vacuum, BSE, and visible light • Beware of ground loops, noise (TV monitors) , lights in the chamber (the ChamberScope !)
System peaks Lens • X-rays are also produced by electrons hitting the lens, the aperture and the chamber walls. • To keep these system peaks to an acceptable level a collimator must look at the point where the beam hits the surface. Chamber wall aperture EDS sample
Detector position • The working distance must be set to the correct value in order to maximize count rate and minimize the systems background • 12 mm in the S4700
Deadtime • Processing and displaying pulse takes some finite time • MCAs (multi-channel analyzer) only handle one pulse at a time so some pulses will be missed • This ‘deadtime’ must be allowed for in quantitative analysis
How much deadtime? • Deadtime increases with count rate (beam current and energy) and process time (set by operator) • Values greater than 25% may allow 2 or more pulses to hit detector at same time giving ‘sum’ peak. • Values >50% waste time and may cause artifacts
MCA parameters • During spectrum acquisition the operator has control of a variety of parameters • The most important of these are the beam current, which controls the input count rate, and the pulse processing time • The processing time must be set with care to achieve optimum results
Count throughput • For spectra choose a low count rate, and a long process time to give best resolution • For x-ray mapping choose the highest beam current and the shortest process time to give highest throughput
Resolution • The spatial resolution and depth penetration of a microanalysis is set by beam energy and material • Typically of order of 1 micron but can be much less if E is close to Ecrit • Monte Carlo models are a valuable aid in understanding the lateral and depth resolution of X-ray microanalysis
Reading the spectrum • GOLDEN RULE- identify the highest energy peaks first • Then find all other family members of this peak i.e the L,M lines • Then identify the next highest energy peak
If a peak cannot be identified.. • Is it a sum peak ? (look for dominant peaks at lower energies, one half of the energy.) • Is it an escape peak ? (look for a strong peak 1.8keV higher in energy) • Is the system calibrated properly? • Is it really a line? - is it of the right width, does it have the right shape, are there enough counts to be sure ? How would we know?
Detectable limits • For an X-ray line to be statistically valid it must exceed the noise (randomness) in the corresponding background region of the spectrum by a suitably large factor • Rule of thumb the peak should be twice the background to be considered valid 10x 2x 1x? 5x 10x Visibility and peak height
Counting statistics • The signal is equal to the peak integral - background • Poisson statistics apply to the data so the noise estimate = (background)1/2 • For 95% confidence we need the signal to be 3 standard deviations over noise • Peak>3.(background)1/2 Bkg =25 Peak>15 Bkg =100 Peak>30 Bkg =250 Peak>50 i.e minimum size of peak falls as fraction of BKG as count rises
Detection limits • This statistical limit determines the lowest concentration of an element that might be detectable (MDL - the minimum detectable limit) • For an EDS system this is typically in the range 1-5% depending on the overall count acquired in the spectrum and on the actual elements involved
Optimizing MDL • Count for as long as possible • Since P/B (peak to background) rises with beam energy use the highest keV possible • Set MCA process time for highest detector energy resolution • Maximize take-off angle where possible • Minimize system peaks, spurious signal
Trace detection ? • EDS is not a trace detection technique - needs a 10x improvement to achieve even parts per thousand level • But minimum detectable mass (MDM) is very good (10-12 to 10-15 grams) for this technique • Best with inhomogeneous samples
Low Energy Microanalysis • The reduction in interaction volume makes possible high spatial resolution microanalysis even from solid samples • Lower cps and lower dead times X-ray generation in silicon at 3keV
Microanalytical Performance • Count rates are lower than at conventional beam energies • K lines are better than M lines. L lines are lowest in yield • Beam energy will determine which elements can be analyzed
Practical Problems for Low Energy EDS • All available lines are in 0-3keV range • There are more than 60 elemental lines between 0 and 2keV, and more than 30 between 2 and 4keV • Spectrometers with better than 30eV resolution are needed! Distribution of X-ray lines as a function of spectral energy