Influence of miRNAs on Cell Proliferation and Gene Expression in Prostate Cancer Cells
30 likes | 113 Vues
This study investigates the impact of miRNAs miR-1 and miR-133a on cell proliferation and gene expression in PC3 and DU145 prostate cancer cells. Results show significant changes in expression levels of TAGLN2, LASS2, PNP, C4orf34, STXBP4, and WDR78. Overall, miR-1 and miR-133a resulted in altered gene expression, suggesting potential roles in prostate cancer progression.

Influence of miRNAs on Cell Proliferation and Gene Expression in Prostate Cancer Cells
E N D
Presentation Transcript
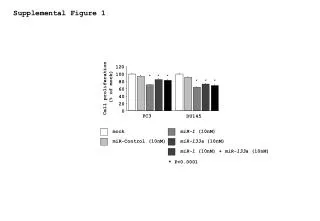
Supplemental Figure 1 120 100 * * * * * * 80 Cell proliferation (% of mock) 60 40 20 0 mock miR-1 (10nM) PC3 DU145 miR-Control (10nM) miR-133a (10nM) miR-1 (10nM) + miR-133a (10nM) * P<0.0001
TAGLN2 LASS2 .000008 .0006 .000006 .0004 .000004 .0002 .000002 0 0 PNP C4orf34 STXBP4 0.04 0.8 0.7 0.03 1.2 0.6 1.0 0.5 0.02 0.8 0.4 0.6 0.3 0.01 0.4 0.2 0.2 0 0 0 Non-PCa PCa Supplemental Figure 4 WDR78 P=0.0030 P<0.0001 P=0.0030 .000005 .000004 .000003 Expression levels of LASS2 (Normalized to GAPDH) Expression levels of WDR78 (Normalized to GAPDH) Expression levels of TAGLN2 (Normalized to GAPDH) .000002 .000001 0 P=0.3749 P=0.0097 Expression levels of C4orf34 (Normalized to GAPDH) Expression levels of PNP (Normalized to GAPDH) Expression levels of STXBP4 (Normalized to GAPDH) P<0.0001
12.0 10.0 8.0 PNP mRNA expression (relative to normal tissue) 6.0 4.0 2.0 0 PC3 DU145 Non-PCa Supplemental Figure 5


