Download
1 / 17
170 likes | 214 Vues
Learn to evaluate and graph exponential functions, identify patterns, and apply models with practical examples.

E N D
Objectives Evaluate exponential functions. Identify and graph exponential functions. Vocabulary Exponential function
Notes In 1-2, Tell whether each set of ordered pairs represents a line or an exponential function. 1. {(0, 0), (1, –8), (2, –16), (3, –24)} 2. {(0,–5), (1, –2.5), (2, –1.25), (3, –0.625)} 3. Graph y = –0.5(6)x. 4. In 2000, the population of Texas was about 21 million, and it was growing by about 2% per year. At this growth rate, the function f(x) = 21(1.02)x gives the population, in millions, x years after 2000. Using this model, calculate the present population of Texas? 5. Depression, Texas a town on 1200 is shrinking by a rate of 8% per year (since 2000). Write an exponential model. And, using this model, find the present population ?
The table and the graph show an insect population that increases over time.
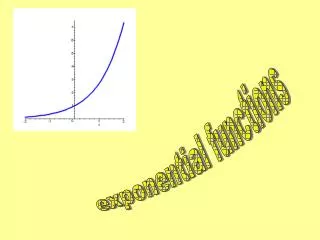
A function rule that describes the pattern above is f(x) = 2(3)x. This type of function, in which the independent variable appears in an exponent, is an exponential function. Notice that 2 is the starting population and 3 is the amount by which the population is multiplied each day.
Example 1A: Evaluating an Exponential Function The function f(x) = 500(1.035)x models the amount of money in a certificate of deposit after x years. How much money will there be in 6 years? f(x) = 500(1.035)x Write the function. Substitute 6 for x. f(6) = 500(1.035)6 Evaluate 1.0356. = 500(1.229) = 614.63 Multiply. There will be $614.63 in 6 years.
Example 1B: Evaluating an Exponential Function The function f(x) = 200,000(0.98)x, where x is the time in years, models the population of a city. What will the population be in 7 years? f(x) = 200,000(0.98)x Substitute 7 for x. f(7) = 200,000(0.98)7 Use a calculator. Round to the nearest whole number. 173,625 The population will be about 173,625 in 7 years.
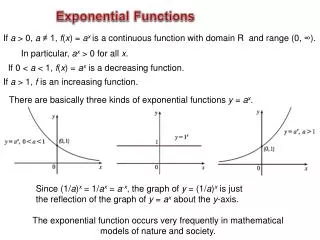
Remember that linear functions have constant first differences and quadratic functions have constant second differences. Exponential functions do not have constant differences, but they do have constant ratios. As the x-values increase by a constant amount, the y-values are multiplied by a constant amount. This amount is the constant ratio and is the value of b in f(x) = abx.
+ 1 3 3 + 1 3 + 1 Example 2A: Identifying an Exponential Function Tell whether each set of ordered pairs satisfies an exponential function. Explain your answer. {(0, 4), (1, 12), (2, 36), (3, 108)} This is an exponential function. As the x-values increase by a constant amount, the y-values are multiplied by a constant amount.
+ 1 + 64 + 1 + 64 + 1 + 64 Example 2B: Identifying an Exponential Function Tell whether each set of ordered pairs satisfies an exponential function. Explain your answer. {(–1, –64), (0, 0), (1, 64), (2, 128)} This is not an exponential function. As the x-values increase by a constant amount, the y-values are not multiplied by a constant amount.
Notes: Part I Tell whether each set of ordered pairs satisfies an exponential function. Explain your answer. 1. {(0, 0), (1, –2), (2, –16), (3, –54)} No; for a constant change in x, y is not multiplied by the same value. 2. {(0,–5), (1, –2.5), (2, –1.25), (3, –0.625)} Yes; for a constant change in x, y is multiplied by the same value.
• • • • Example 3A: Graphing Graph y = 0.5(2)x. Choose several values of x and generate ordered pairs. Graph the ordered pairs and connect with a smooth curve.
• • • • Example 3B: Graphing Graph y = 0.2(5)x. Choose several values of x and generate ordered pairs. Graph the ordered pairs and connect with a smooth curve.
y =– (2)x • • • • 1 4 Example 4A: Graphing Choose several values of x and generate ordered pairs. Graph the ordered pairs and connect with a smooth curve.
• • • • Example 4B: Graphing Graph each exponential function. y = 4(0.6)x Choose several values of x and generate ordered pairs. Graph the ordered pairs and connect with a smooth curve.
y = 4()x • 1 4 • • • Example 4C: Graphing Graph each exponential function. Graph the ordered pairs and connect with a smooth curve. Choose several values of x and generate ordered pairs. x
Lesson Quiz: Part II 3. Graph y = –0.5(6)x. 4. In 2000, the population of Texas was about 21 million, and it was growing by about 2% per year. At this growth rate, the function f(x) = 21(1.02)x gives the population, in millions, x years after 2000. Using this model, calculate the present population of Texas? 5. Depression, Texas a town on 1200 is shrinking by a rate of 8% per year (since 2000). Write an exponential model. And, using this model, find the present population ?
Lesson Quiz: Part III 4. In 2000, the population of Texas was about 21 million, and it was growing by about 2% per year. At this growth rate, the function f(x) = 21(1.02)x gives the population, in millions, x years after 2000. Using this model, calculate the present population of Texas? 5. Depression, Texas a town on 1200 is shrinking by a rate of 8% per year (since 2000). Write an exponential model. And, using this model, find the present population ?