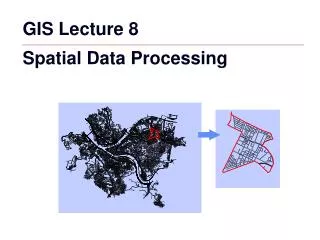
GIS Lecture 9 Spatial Analysis
GIS Lecture 9 Spatial Analysis. Outline. Proximity Buffers Spatial Joins on Buffers Visual Basic Scripts Apportionment. Proximity Buffers. Proximity. Buffers Created Points Lines Polygons. Points. Buffer created by assigning a buffer distance around points.

GIS Lecture 9 Spatial Analysis
E N D
Presentation Transcript
GIS Lecture 9 Spatial Analysis
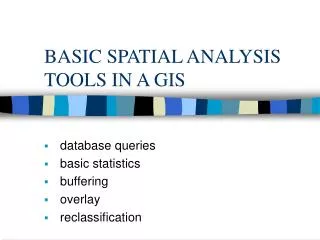
Outline • Proximity Buffers • Spatial Joins on Buffers • Visual Basic Scripts • Apportionment
Proximity Buffers Created • Points • Lines • Polygons
Points Buffer created by assigning a buffer distance around points
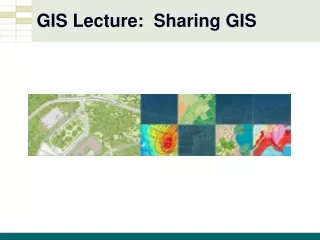
Green Spaces Near Schools - Polygon buffer created ¼ and ½ mile around schools
Businesses near Convention Center • Businesses that are with ¼ mile of Convention Center
Campus Safety Polygon buffer 20’ around lights in a parking lot
Lines Buffer created by assigning a buffer distance around lines
Line Buffer Example Access-to-Work Study (Pittsburgh Foundation) - Polygon buffer created around PAT Bus Routes - Shows 15 minute ride times
Line Buffer Example Another buffer shows 30 minute ride times
Line Buffer Example …45 minutes
Line Buffer Example …60 minutes
Line Buffer Example Street Study - Polygon buffer created ¼ mile around selected streets
Polygons Buffer created by assigning a buffer distance around polygons
Spatial Joins on Buffers • Spatially join Toxic Release sties to buffers • Count appears in new buffer
Visual Basic Scripts Adding Area and Perimeter to Polygons Finding Polygon Centroids
Area and Perimeter VB Script Advanced calculations for finding area, perimeter, and length of features
Area and Perimeter VB Script • Add field in shapefile (e.g. area) • Use calculator function and Visual Basic Script to calculate polygon areas
Area and Perimeter VB Script Result is the area of each polygon feature
Polygon Centroids • Advanced calculations for finding polygon centroids • Added as an XY Data Layer
Adds XY Data to Attribute Table Point Centroid VB Script
Polygon Centroids Export attributes as table Add as XY Data…
Apportionment Example You want to know the population of a ZIP code but only have census tracts Approximate the population of zip codes using Census Tracts
Population Apportionment • Begin with census tract population
Population Apportionment Overlay zip codes which are non-coterminous
Population Apportionment Use census tracts to estimate the population in each zipcode Or use census blocks for better estimates
Other examples of apportionment Population by voting district
Other census data to apportion… • SF1 Census Data • Population (tract, block group, and block) • Age (tract, block group, and block) • Race (tract, block group, and block) • Housing Units (tract, block group, and block) • SF3 Census Data • Educational Attainment (tract and block group only) • Income (tract and block group only) • Poverty Status (tract and block group only) • Others?
Advanced Apportionment:Tutorial Example • Police want to know the number of under-educated persons (over Age22) in their car beats • Under-educated data is located in Census tracts (not car beat polygons)
Apportion Data for Non-CoterminousPolygons Apportioning (makes approximate splits) of each tract’s data to two or more car beats.
Approach to Apportionment Better to use census block centroid data • Areas are smaller than Census Tracts (better population estimates) • Each centroid has census data attached to it • Problem:Centroids DO NOThave the under-educateddata, census tracts do
The Math of Apportionment Zoomed view of 2 car beats and one tract • Beat 261 and 251 • Tract 360550002100
13 block centroids Lie in beat 261 Pop. >22=1,177 13 block centroids Lie in beat 251 Pop. >22=1,089 The Math of Apportionment Tract 360550002100 • has 205 persons aged 25 or older with less than a HS education • 26 block centroids span 2 beats Total Population=2,266
The Math of Apportionment Apportionment assumes that the fraction of under educated persons 25 or older is the same as that for the general population aged 25 or older: • Beat 261: 1,177/2,266 = 0.519 • Beat 251: 1,089/2,266 = 0.481
The Math of Apportionment • 205 is the number of under-educated people in tract 36055002100 • Thus we estimate the contribution of tract 36055002100 to car beat 261’s under-educated population to be (1,177/2,266)x205 = 106. For car beat 251 it is (1,089/2,266)x205 = 99 • To calculate this in GIS, we need to performintersects and joins…
Apportionment Steps Block Centroids • Add two fields: TRACTID and SumAge22 • TRACTID is a the census tract ID numbers (for later joins to census tracts and summaries) • SumAge22 is the summary of population Age22+ (calculating multiple age columns)
Apportionment Steps From the block centroids, create a new summary table counting the number of persons Age22+ for each census tract
Apportionment Steps • Create a new layer intersecting car beats and census tracts • Fields will include values from both tables
Apportionment Steps • Spatially join the new intersecting layer of car beats and census tracts (polygons) to block centroids (points) • New points will have beat and census tract data
Apportionment Steps Check Apportionment Weights • Create apportionment weight denominator • Join the summary table of Age22 or greater to the newly created points • The result is the summary of Age22 or greater population is now on block centroid points
Apportionment Steps • Compute Apportionment Weights • Create new block centroid field called Weight
Apportionment Steps • Create new block centroid field called UnderEducated