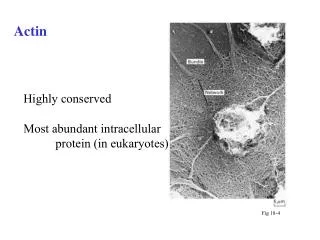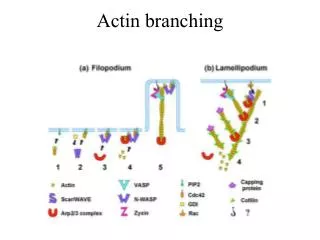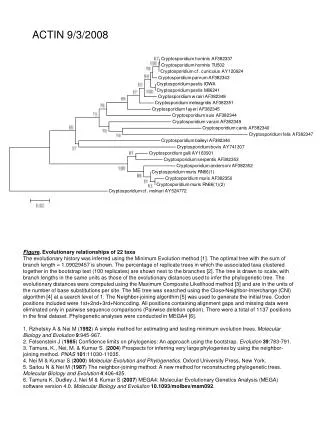
Actin
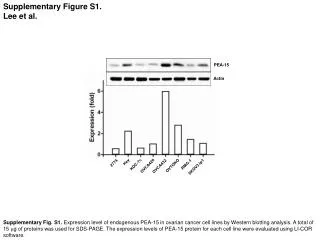
Supplementary Figure S1. Lee et al. PEA-15. Actin. Hey. 2774. RMG-1. KOC-7c. OVTOKO. OVCA420. OVCA432. SKOV3.ip1.

Actin
E N D
Presentation Transcript
Supplementary Figure S1. Lee et al. PEA-15 Actin Hey 2774 RMG-1 KOC-7c OVTOKO OVCA420 OVCA432 SKOV3.ip1 Supplementary Fig. S1. Expression level of endogenous PEA-15 in ovarian cancer cell lines by Western blotting analysis. A total of 15 mg of proteins was used for SDS-PAGE. The expression levels of PEA-15 protein for each cell line were evaluated using LI-COR software.
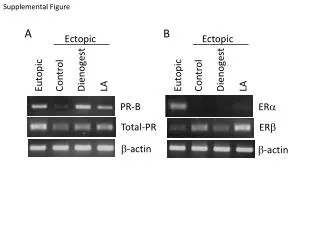
Supplementary Figure S2. Lee et al. A B Vector MMP-7 PEA-15-AA PEA-15-DD Supplementary Fig. S2. PEA-15-AA-expressing cells showed downregulation of b-catenin target genes. To test the effect of PEA-15-AA-induced-b-catenin inhibition on b-catenin target genes, we performed quantitative RT-PCR and immunohistochemical staining. (A) Quantitative RT-PCR analysis of c-myc and c-met. (B) Immunohistochemical staining of MMP-7 using xenograft tumor samples. Scale bars: 50 mm.
Supplementary Figure S3. Lee et al. pPEA-15-S104 pPEA-15-S116 Supplementary Fig. S3. PEA-15 phosphorylated at Ser104 (pPEA-15-S104) and PEA-15 phosphorylated at Ser116 (pPEA-15-S116) were highly overexpressed in breast tumor tissues. To investigate the expression status of pPEA-15-S104, pPEA-15-S116, and b-catenin, we performed immunohistochemical staining using a human breast tumor microarray (US Biomax Inc). Original magnification, ×200 (insets, ×40). b-catenin Tumor tissue Cancer-adjacent normal tissue
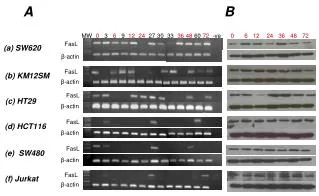
Supplementary Figure S4. Lee et al. B A Supplementary Fig. S4. Effect of PEA-15s in an ovarian cancer xenograft model. (A). Upper table showed incidence of tumor formation of vector, PEA-15-WT, PEA-15-WT, PEA-15-DD-3, and PEA-15-AA-1 clone. Lower panel, tumor weights were significantly smaller with PEA-15-AA-1 clone than with vector (P<0.0001), PEA-15-WT (P=0.0039), and PEA-15-DD-3 (P<0.0001) clone. (B). Representative images showed tumor formation of SKOV3.ip1-vector, SKOV3.ip1-PEA-15-WT, SKOV3.ip1-PEA-15-DD-3 and SKOV3.ip1-PEA-15-AA-1 cells in mouse peritoneal area. White arrows indicate tumors.
Supplementary Table S1. Lee et al. Supplementary Table S1. Incidence of high and low b-catenin expression levels in PEA-15-AA, PEA-15-DA, and PEA-15-DD tumor tissues.