Download

1 / 10
100 likes | 118 Vues
This study explores the potential threats to ecosystems caused by human population growth, using a statistical model to predict future biodiversity threats. The model considers population data and ecological characteristics of different nations.

E N D
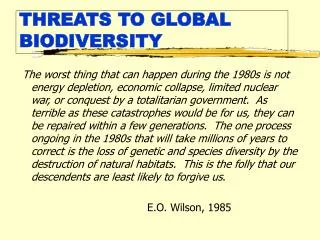
Forecasting global biodiversity threats associated with human population growth
Population growth Birth rateDeath rateGrowth rateDensity 2000 21.2(/1000) 8.8(/1000) 1.25 46.4 2004 17.5(/1000) 8.7(/1000) 0.88 57.4 2050 13.8(/1000) 9.7(/1000) 0.42 69.3
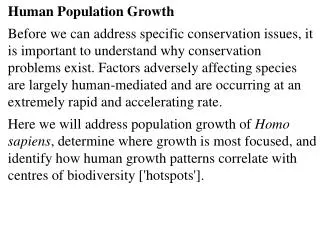
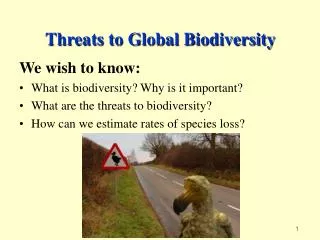
Introduction Background • Possible threats to ecosystems are human density and population growth • However population growth rate is not a good estimator of exact threat • Biodiversity still shown to relate to human population size Past studies • Density of humans related to threatened bird species (Kerr & Currie 1995) and threatened plant species (Thompson & Jones 1999) Current study • Based in relationship between human density and threats to biodiversity a statistical model was built to predict future threats • The model included population data and ecological characteristics of various nations
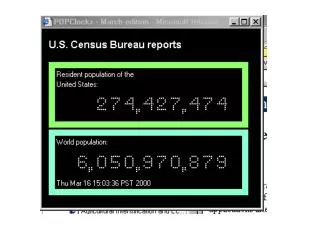
Methods Data utilized • Total number of mammal and bird species data as reported by nation according to UNEP-WCMC Animals of the World Database • IUCN Red List of 2000 on critically endangered, endangered and vulnerable species • Mean annual temperature per nation • Mean annual precipitation per nation • Human census data for 2000, 2020 and 2050 from U.S. Census Bureau • Tested 114 of 230 nations review • small and island nations excluded • some nation’s data incomplete
Methods Analysis • Chose potential variables that would be significantly correlated with a number of threatened species • To account for nation size all frequency variables were divided by geographic area in 106 km2 • Variables log-transformed to normalize distributions • Subset of predictor variables chose for multiple regression analysis
Results Table 1. Linear regression correlates of the number of threatened mammal and bird species per unit area (log 10) • Human population density significantly correlated with threatened species per unit area { r2 = 0.402 P < 0.001} • Greatest correlation with species richness • Mean precipitation correlated, but temperature did not
Results • Fig. 1. Predicted vs. actual values of log-transformed density of threatened species per nation for the year 2000 based on the multiple regression model: log threatened species per 106 km2=-1.534+0.691 × log species richness+0.259 × human population density. • Linear regression model showed human population and species richness good combined predictors
Results • Growing populations show increased threat to species, while declining populations show slight decrease in threat • Median increase = 1.6 by 2020 and 3.0 by 2050 • Largest increase threat due to high species diversity and growth rate of 3.19% is in Congo with 26 additional threatened species by 2050 • United States has possible increase of 10 threatened species by 2050 although growth rate is 0.91% • Although 100 of 114 nations show increase of threat by 2020, 10 of those show decrease in threat by 2050
Results • Fig. 2: Forecast changes in number of mammal and bird species threatened for each of the 114 nations in 2050.
Discussion • Model demonstrates that 87.9% of differences in number of threatened species can be accounted for by human population density and species richness • The other 12.1% not explained by density could be due to endemic species • Climate change and economic from growth could also affect biodiversity • Model can be used to project threat of extinction based on population growth • Model needs to be expanded: Brazil’s threatened species were underestimated showing that population density within a country cannot always account for threat alone without including demands of other countries • Ultimately shows that if model can be projected to other taxa then there is a serious threat to biodiversity worldwide