
Uploaded by
field
1 SLIDES
157 VUES
10LIKES
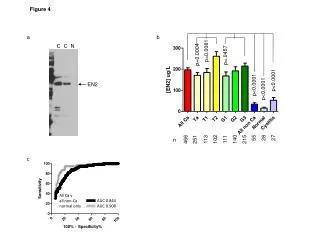
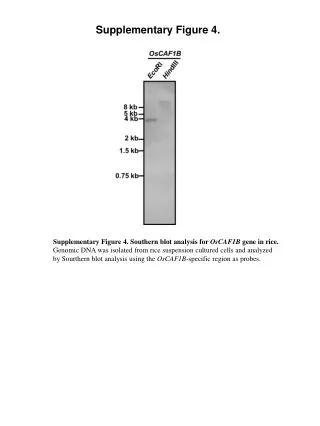
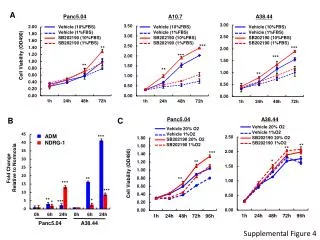
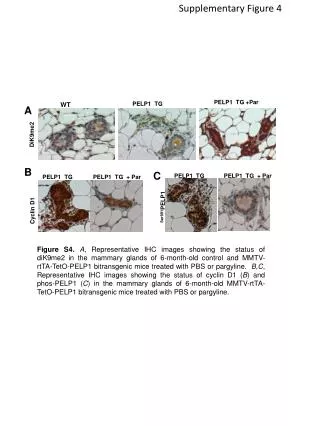
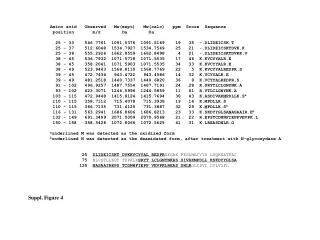
Statistical Analysis of EN2 Expression in Cancer vs. Non-Cancer Samples
DESCRIPTION
This study presents a comprehensive statistical analysis of EN2 expression across cancerous and non-cancerous samples. The results indicate significant differences, with p-values of 0.0081, 0.0004, and
Download
1 / 1
Télécharger la présentation 
Statistical Analysis of EN2 Expression in Cancer vs. Non-Cancer Samples
An Image/Link below is provided (as is) to download presentation
Download Policy: Content on the Website is provided to you AS IS for your information and personal use and may not be sold / licensed / shared on other websites without getting consent from its author.
Content is provided to you AS IS for your information and personal use only.
Download presentation by click this link.
While downloading, if for some reason you are not able to download a presentation, the publisher may have deleted the file from their server.
During download, if you can't get a presentation, the file might be deleted by the publisher.
E N D
Presentation Transcript
Figure 4 a b C C N p=0.0081 p=0.0004 p=.0457 p<0.0001 EN2 p<0.0001 p<0.0001 55 28 27 466 251 113 102 111 140 215 n c All Ca v all non-Ca normal only AUC 0.844 AUC 0.908
More Related