Download
1 / 2
20 likes | 170 Vues
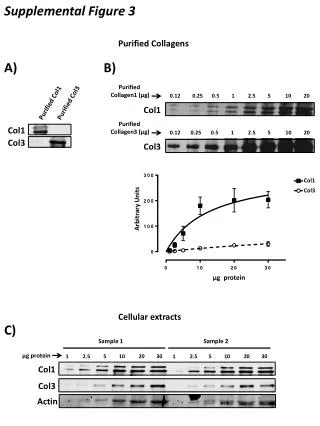
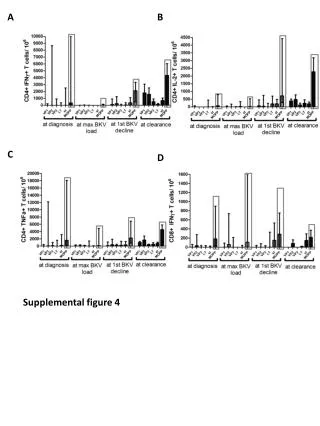
A. B. C. D. Supplemental figure 4. Supplemental Figure S4. Kinetics of total IFN γ + (A), IL-2+ (B) and TNFa+ (C) CD4+ and IFN γ + (D) CD8+ T-cell responses in KTRs during the clinical course of BKV re-activation

E N D
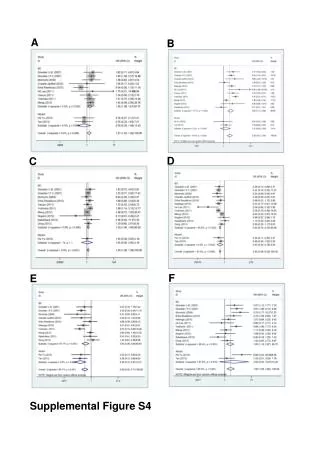
A B C D Supplemental figure 4
Supplemental Figure S4. Kinetics of total IFNγ+ (A), IL-2+ (B) and TNFa+ (C) CD4+ and IFNγ+ (D) CD8+ T-cell responses in KTRs during the clinical course of BKV re-activation Figures A, B, C, D show the median frequencies with inter-quartile range of BKV-specific CD4+ and CD8+ T cells that produce IFNγ, IL-2 and TNFa, respectively upon VP1-, VP2-, VP3-, LT-, st- single stimulation (SOPP) in comparison with MOPP stimulation and after background subtraction at the time of diagnosis, maximum BKV load, first BKV decline and clearance. MOPP stimulation approach enabled much more efficient monitoring of BKV-specific cellular kinetics during the clinical course of BKV reactivation compared to SOPP stimulations.