Exploring Calcium Influx Rates in Orai1 Mutants Using Fluorescent Imaging
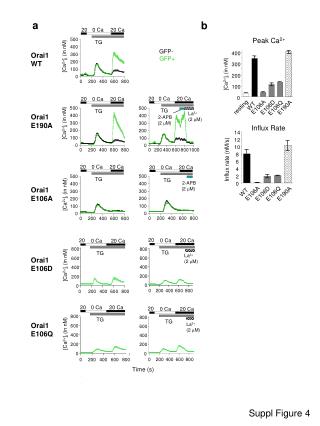
This study investigates calcium influx rates in Orai1 mutants through live cell imaging. Various mutations were examined, and their impact on intracellular calcium levels was measured, providing insights into calcium signaling pathways.

Exploring Calcium Influx Rates in Orai1 Mutants Using Fluorescent Imaging
E N D
Presentation Transcript
500 500 500 500 400 400 400 400 300 300 300 300 200 200 200 200 100 100 100 100 0 0 0 0 0 0 0 0 200 200 200 200 400 400 400 400 600 600 600 600 800 800 800 800 500 400 300 200 100 0 a b 20 0 Ca 20 Ca Peak Ca2+ TG GFP- Orai1 WT 400 [Ca2+]i (in nM) GFP+ 300 [Ca2+]i (in nM) 200 100 0 Ca 20 Ca 20 20 0 Ca 20 Ca 0 WT E106A resting E106D E190A E106Q TG TG La3+ (2 mM) Orai1 E190A 2-APB (2 mM) [Ca2+]i (in nM) Influx Rate 14 12 10 0 200 400 600 800 1000 8 Influx rate (nM/s) 6 20 0 Ca 20 Ca 20 0 Ca 20 Ca 4 2 TG TG 2-APB (2 mM) 0 Orai1 E106A WT E106A E106D E106Q E190A [Ca2+]i (in nM) 20 0 Ca 20 Ca 20 0 Ca 20 Ca 800 800 TG TG La3+ (2 mM) Orai1 E106D 600 600 [Ca2+]i (in nM) 400 400 200 200 0 0 200 400 600 800 0 0 200 400 600 800 20 0 Ca 20 Ca 20 0 Ca 20 Ca 800 TG 800 TG Orai1 E106Q La3+ (2 mM) 600 600 [Ca2+]i (in nM) 400 400 200 200 0 0 0 200 400 800 600 0 200 400 600 800 Time (s) Suppl Figure 4