
Uploaded by
brant
1 SLIDES
162 VUES
10LIKES
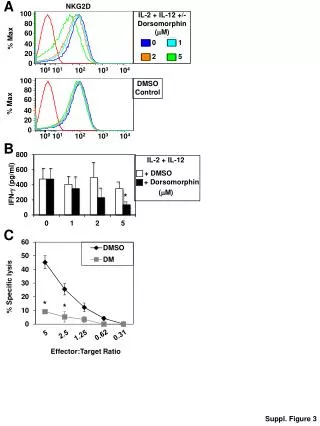
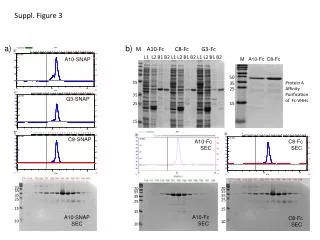
Suppl. Figure 3
DESCRIPTION
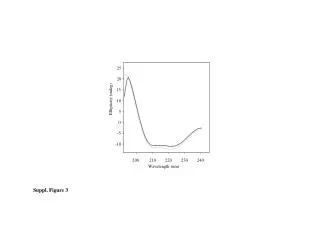
A. NKG2D. IL-2 + IL-12 +/- Dorsomorphin ( M). 100. 80. 60. % Max. 0. 1. 40. 20. 2. 5. 0. 10 0. 10 1. 10 2. 10 3. 10 4. 100. DMSO C ontrol. 80. 60. % Max. 40. 20. 0. 10 0. 10 1. 10 2. 10 3. 10 4. B. IL-2 + IL-12. + DMSO. ( M). + Dorsomorphin.
Download
1 / 1
Télécharger la présentation 
Suppl. Figure 3
An Image/Link below is provided (as is) to download presentation
Download Policy: Content on the Website is provided to you AS IS for your information and personal use and may not be sold / licensed / shared on other websites without getting consent from its author.
Content is provided to you AS IS for your information and personal use only.
Download presentation by click this link.
While downloading, if for some reason you are not able to download a presentation, the publisher may have deleted the file from their server.
During download, if you can't get a presentation, the file might be deleted by the publisher.
E N D
Presentation Transcript
A NKG2D IL-2 + IL-12 +/- Dorsomorphin (M) 100 80 60 % Max 0 1 40 20 2 5 0 100 101 102 103 104 100 DMSO Control 80 60 % Max 40 20 0 100 101 102 103 104 B IL-2 + IL-12 + DMSO (M) + Dorsomorphin IFN- (pg/ml) * C % Specificlysis * * 5 1.25 2.5 0.62 0.31 Effector:Target Ratio Suppl. Figure 3
More Related