
Uploaded by
shadow
1 SLIDES
152 VUES
10LIKES
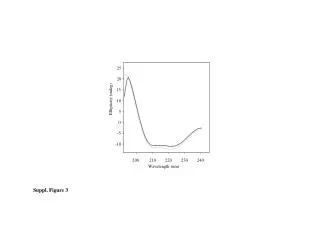
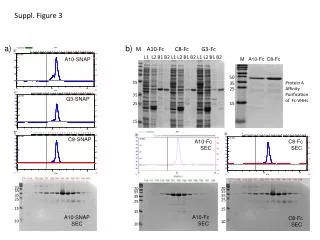
Analysis of Ellipticity and Wavelength Variations in Sample 25.20.15
DESCRIPTION
This study presents Figure 3, which illustrates the relationship between ellipticity (measured in millidegrees) and varying wavelengths across several samples. With a focus on the data ranges from -10 to 240 nm, this figure provides insights into the optical properties and molecular interactions relevant to the samples analyzed. Key trends in ellipticity variation are discussed in relation to changes in wavelength, enhancing our understanding of the material's behavior under different light conditions.
Download
1 / 1
Télécharger la présentation 
Analysis of Ellipticity and Wavelength Variations in Sample 25.20.15
An Image/Link below is provided (as is) to download presentation
Download Policy: Content on the Website is provided to you AS IS for your information and personal use and may not be sold / licensed / shared on other websites without getting consent from its author.
Content is provided to you AS IS for your information and personal use only.
Download presentation by click this link.
While downloading, if for some reason you are not able to download a presentation, the publisher may have deleted the file from their server.
During download, if you can't get a presentation, the file might be deleted by the publisher.
E N D
Presentation Transcript
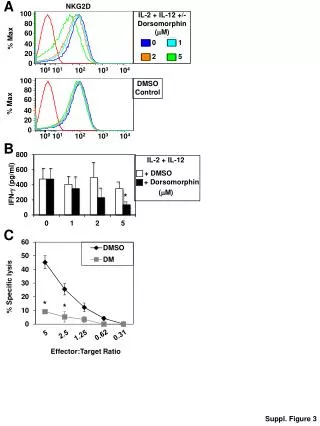
25 20 15 Ellipticity (mdeg) 10 5 0 -5 -10 200 210 220 230 240 Wavelength (nm) Suppl. Figure 3
More Related