exponential functions
exponential functions. 8. 7. 6. 5. 4. 3. 2. 1. -7. -2. -1. 1. 3. 5. 7. -6. -5. -4. -3. -2. -3. -4. -5. 0. 4. 6. 8. -6. -7. 2.

exponential functions
E N D
Presentation Transcript
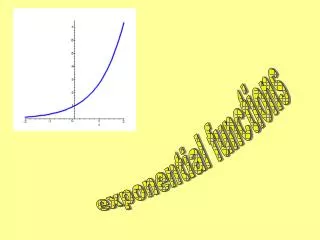
8 7 6 5 4 3 2 1 -7 -2 -1 1 3 5 7 -6 -5 -4 -3 -2 -3 -4 -5 0 4 6 8 -6 -7 2 Let’s examine exponential functions. They are different than any of the other types of functions we’ve studied because the independent variable is in the exponent. Let’s look at the graph of this function by plotting some points. x 2x 38 2 4 BASE 1 2 0 1 Recall what a negative exponent means: -1 1/2 -2 1/4 -3 1/8
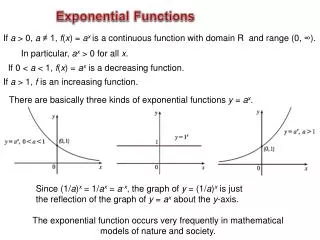
Compare the graphs 2x, 3x , and 4x Characteristics about the Graph of an Exponential Function where a > 1 1. Domain is all real numbers 2. Range is positive real numbers 3. There are no x intercepts because there is no x value that you can put in the function to make it = 0 What is the range of an exponential function? What is the x intercept of these exponential functions? Can you see the horizontal asymptote for these functions? What is the domain of an exponential function? What is the y intercept of these exponential functions? Are these exponential functions increasing or decreasing? 4. The y intercept is always (0,1) because a 0 = 1 5. The graph is always increasing 6. The x-axis (where y = 0) is a horizontal asymptote for x -
All of the transformations that you learned apply to all functions, so what would the graph of look like? up 3 right 2 down 1 Reflected over x axis up 1
Reflected about y-axis This equation could be rewritten in a different form: So if the base of our exponential function is between 0 and 1 (which will be a fraction), the graph will be decreasing. It will have the same domain, range, intercepts, and asymptote. There are many occurrences in nature that can be modeled with an exponential function. To model these we need to learn about a special base.
The Base “e” (also called the natural base) To model things in nature, we’ll need a base that turns out to be between 2 and 3. Your calculator knows this base. Ask your calculator to find e1. You do this by using the ex button (generally you’ll need to hit the 2nd or yellow button first to get it depending on the calculator). After hitting the ex, you then enter the exponent you want (in this case 1) and push = or enter. If you have a scientific calculator that doesn’t graph you may have to enter the 1 before hitting the ex. You should get 2.718281828 Example for TI-83
If au = av, then u = v This says that if we have exponential functions in equations and we can write both sides of the equation using the same base, we know the exponents are equal. The left hand side is 2 to the something. Can we re-write the right hand side as 2 to the something? Now we use the property above. The bases are both 2 so the exponents must be equal. We did not cancel the 2’s, We just used the property and equated the exponents. You could solve this for x now.
The left hand side is 4 to the something but the right hand side can’t be written as 4 to the something (using integer exponents) Let’s try one more: We could however re-write both the left and right hand sides as 2 to the something. So now that each side is written with the same base we know the exponents must be equal. Check:
Acknowledgement I wish to thank Shawna Haider from Salt Lake Community College, Utah USA for her hard work in creating this PowerPoint. www.slcc.edu Shawna has kindly given permission for this resource to be downloaded from www.mathxtc.com and for it to be modified to suit the Western Australian Mathematics Curriculum. Stephen Corcoran Head of Mathematics St Stephen’s School – Carramar www.ststephens.wa.edu.au