Optimizing Profits with Linear Programming
420 likes | 664 Vues
Learn how to efficiently allocate resources and maximize profits using linear programming. Understand constraints, objective setting, writing equations, and solving problems.

Optimizing Profits with Linear Programming
E N D
Presentation Transcript
Linear Programming • A mathematical technique for the efficient allocation of scarce resources. • You are either “Maximizing” or “Minimizing” something. • Minimizing time • Minimizing costs • Minimizing material use • Maximizing profits • This is called “The Objective” or “The Objective Function.”
Linear Programming • Linear programming is decision making under certainty. • It uses an iterative, algebraic procedure for simultaneously solving a set of linear equations. • Special-purpose programs can be developed for applications that must be repeated frequently. • You have already used linear programming for the Transportation Method of Facility Location. • It minimized the shipping costs between supply locations and demand locations.
Setting up the Problem • The first step is to identify the objective. • What is being maximized or minimized? (In the Location homework you were minimizing shipping costs.) • Next you must identify the scarce resources. (In any attempt to maximize or minimize an objective, we are constrained by resources.) • These scarce resources are called “Constraints.” • Constraints may be anything required by a process. (Time, money, material, people, etc.) In the transportation model you were constrained by the number of locations, the capacity to produce and the amount of demand.
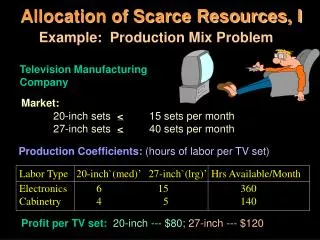
Constraints (Scarce Resources) Example • A company makes cheap tables and chairs using only woodand labor. • To make a chair requires 10 hoursof labor and 20 board feetof wood. • To make a table requires 5 hours of laborand 30 board feet of wood. • The profit is $8 per chair and $6 per table. • If it has 300 board feet of wood and 110 hours of laboravailable each day, how many tables and chairs should it make to maximize profits? Objective
Setting Up the Problem • Profits: $6 per table and $8 per chair Total Profits = 6T + 8C • Constraints: 300 feet of wood per day 110 hours labor per day • Wood Use: 30 feet per table 20 feet per chair • Labor Use: 5 hours per table 10 hours per chair
Writing the Equations • Objective: Maximize Z = 6T + 8C Maximum Profits = ($6 x # of tables) + ($8 x # of chairs) • Subject to: • 30T + 20C < 300 board feet (wood constraint) • 5T + 10C < 110 hours (labor constraint) T,C > 0 (non-negativity)
Writing the Equations Maximize Z = 6 T + 8 C Subject to: 30 T + 20 C < 300 (wood constraint) 5 T + 10 C < 110 (labor constraint) T, C > 0 (non-negativity)
Inequalities • A resource may constrain a problem by being . . . • Equal-to… = • Equal-to or greater-than… => or > • Equal-to or less-than… =< or < • Greater-than… > • Less-than… < . . .the amount of resource available.
Computers can’t deal with inequalities • The computer converts “Less-than or Equal-to” variables, and “Less-than” variables to “Equal-to” variables by adding a slack variable. 30T + 20C < 300 (wood constraint) becomes 30T + 20C + Sw = 300 • Swrepresents the difference, if any, between the amount of wood used and the amount available. • (It is unused resource) • Slack variables also cannot be negative so S> 0
SURPLUS VARIABLES • If the labor constraint was greater than or equal to the 110 hours; expressed as… • 5 T + 10 C > 110 hours • Then a surplus variable would be needed to be subtracted in order to make it an equality. • 5 T + 10 C - SL= 110 hours • SL represents the excess labor need, if any, above 110 hrs. • (Surplus variables cannot be negative so SL> 0)
Reformulation of the example with Slack Variables added Maximize Z = 6T + 8C Subject to: 30T + 20C < 300 board feet of wood 5T + 10C < 110 hours of labor The L.P. model adds any needed slack and surplus variables. YOU DO NOT ADD THEM. But, if they are needed, they will appear in the program output. Below is how the program adds the slack variables. Maximize Z = 6T + 8C Subject to: 30T + 20C + SW= 300 board feet of wood 5T + 10C + SL = 110 hours of labor T, C,SW, SL >0
Product Mix • The product mixrefers to the mix of products (tables and chairs in this example) that we must make in order to maximize or minimize the objective. • If our solution said to make only chairs, then our product mixwould only be chairs. • Sophisticated problems might have hundreds of “products” in the formulation. • The solution might have only a few dozen. These few dozen products would determine the product mix. • Only the items that appear in the solution determine the product mix!
Solving the Sample Problem Enter the problem data into the POM/QM program and select Maximizeto maximize profits for this particular problem. These are pull-down menus. This is the data from the problem.
POM Solution Screen #1 • The optimal solution is to make four tables and nine chairs. Thus the product mix is tables and chairs. • Maximum profit is $96. • The Dual values are often called Shadow Prices. It is the value (in theory) that would be added to the solution of $96 if you had an additional unit of constraining (scarce) resource.
Solution Screen #1 If a shadow price (Dual column) appears, it means that you have used up all of that constraint (resource). Thus more of that scarce resource is worth something. The shadow price is the dollar amount that an additional increment /unit of that scarce resource would add to profits. In this problem, a shadow (dual) price of $0.10 for wood indicates that you have used up all of your wood and, in theory, if you had one additional board foot of wood, your maximum profit of $96 would increase by $0.10
Sensitivity Analysis (Ranging) The POM program calls this “Ranging.” The idea is that, if you hold all variables constant except one, over what range could you change that one variable without changing the product mix? There are “sensitivity ranges” for the original values in the objective function and for each of the constraints.
Sensitivity Analysis (cont.) If the profit per table goes below $4 or above $12 the product mix will change. (You would not be making one of the items.)Either tables or chairs would drop out of the product mix. If your wood availability goes below 220 board feet or above 660 feet, your product mix will change. You would need to re-run the program with new data to determine which product would drop out of the mix.
This is an example using a different Linear Programming package. Product Mix The value of an additional unit of scarce resource. (POM calls these “Dual” variables.) 10 cents is how much our profit would increase if we had an additional board foot of wood. The maximum profit we can make each day.
The product mix changes if you exceed these ranges Wood Labor Tables Chairs Assumption: Only one variable can be changed at a time.
Formulation Exercise The Marriott Tub Company manufactures two lines of bathtubs, called Model Aand Model B. Every tub requires blending a certain amount of steel and zinc. The company has available a total of 25,000 pounds of steel and 6,000 pounds of zinc.Each Model A yields a profit of $90 and requires a mixture of 125 pounds of steel and 20 pounds of zinc. Each Model B tub earns a profit of $70. It in turn requires 100 pounds of steel and 30 pounds of zinc. What is the best production mix of bathtubs? • What is the objective? Maximize Profits • What is the objective function? Z = 90 A + 70 B • What are the scarce resources? Steel and Zinc • Steel Constraint formulation: 125 A + 100 B <= 25,000 lbs of steel • Zinc Constraint formulation: 20 A + 30 B <= 6,000 lbs of zinc
Bagwell Distributors packages and distributes industrial supplies. A standard shipment can be packaged in either a Class A, a Class K, or a Class Tcontainer. A single class A container yields a profit of $8. A Class K container yields $6 profit, and a Class T container yields $14 profit. Each shipment prepared requires a certain amount of packing material and a certain amount of time to pack. Resources Needed per Standard Shipment Class of Container Packing Material (lbs) Packing Time (Hrs) A 2 2 K 1 6 T 3 4 Amount available: 120 lbs 240 hours Bill Bagwell, head of the firm, must decide the optimal number of each class of container to pack each week. He is bound by the above resource restrictions, but also decides that he must keep his six full-time packers employed all 240 hours (6 workers x 40 hours) each week. • What is the objective? Maximize Profits • What is the objective function? Z = 8A + 6K + 14T • What are the scarce resources? Packing material and Packing time • Material Constraint formulation: 2A + 1K + 3T <= 120 lbs of packing material 2A + 6K + 4T = 240 hrs of packing time • Time Constraint formulation:
LP APPLICATIONS • Aggregate Production Planning • Objective: Finding the minimum-cost production schedule • Constraints: Labor, Capacity & Inventory • Product Planning • Objective: Finding the optimal product mix that will maximize profits • Constraints: The various resources to make the products, labor, time, and costs • Scheduling People • Objective: Minimizing the number of people scheduled. • Constraints: minimum people needed, time periods, hours
LP APPLICATIONS • Transportation Problem • Objective: Minimize shipping costs • Constraints: Capacities of production facilities and demands of receiving facilities • Process Control • Minimize the amount of scrap material generated in a process • Inventory Control • Finding the optimal combination of products to stock in a warehouse or store • Material Handling • Finding the minimum-cost routings of material handling devices between locations.
Summary • Linear Programming can be used in any situation where you are attempting to allocate resources in an optimal manner in order to… • Minimize costs • Minimize time • Minimize waste • Maximize profits
Sample Problem • The Stratton Company produces 2 basic types of plastic pipe. Three resources are crucial to the output of pipe: extrusion hours, packaging hours, and a special additive to the plastic raw material. • Each unit (100’) of Type 1 yields $34, & each unit of Type 2 yields $40. • How much of each type should be manufactured to maximize profits?
Two types of pipe, yielding $34 and $40 profit per 100’ of pipe. Formulating a Problem Step 1: Define the decision variables T1 = amount of type 1 pipe produced and sold per week, (100-foot increments) T2 = amount of type 2 pipe produced and sold per week, (100-foot increments)
Formulating a Problem Step 2: Define the objective function Each unit of T1 yields $34, and each unit of T2 yields $40. Objective is to maximize profits (Z) Max Z = $34T1+ $40T2
4x1 + 6x2 48 2x1 + 2x2 18 2x1 + x2 16 Extrusion Packaging Additive mix Formulating a Problem Step 3: Formulate the constraints
4x1 + 6x2 48 2x1 + 2x2 18 2x1 + x2 16 Extrusion Packaging Additive mix POM/QM Data Entry Each unit (100’) of Type 1 yields $34, & each unit of Type 2 yields $40.
Optimal solution is to make 300 ft of type 1 pipe and 600 ft of type 2 pipe. Thus the product mix is T1 and T2. Maximum profit POM/QM SOLUTION The zero here means that additional mix adds nothing to profits. This indicates that there was more additive mix than needed for this production lot.
If either objective function coefficient (profit per 100’) goes above or below its sensitivity range, the product mix will change. If the availability of one of the constraints (scarce resources) goes above or below its sensitivity range, the product mix will change. All of the extrusion and packaging time were used. An additional hour of extrusion time would contribute $3 to profits. 4 lbs of additive were unused, so its shadow price (dual value) is zero. An additional hour of packaging time is worth $11. POM/QM Sensitivity Analysis The upper boundary for additive mix is infinity because there is unused additive.
Using the Excel Solver In this solver solution, T1 and T2 are X1 and X2
COMPUTER SOLUTIONOutput from Solver © 2013 Lew Hofmann
The coefficient sensitivities provide no new insight here because they are always zero when all decision variables have positive values in the optimal solution. Optimal solution is to make 300 ft of type 1 pipe and 600 ft of type 2 pipe. Thus the product mix is X1 and X2. Maximum profit Excel Solver Solution © 2013 Lew Hofmann
All of the extrusion and packaging time was used. An additional hour of extrusion time would contribute $3 to profits. An additional hour of packaging time is worth $11. 4 lbs of additive were unused (surplus) so its shadow price is zero. Excel Solver Solution © 2013 Lew Hofmann
If either objective function coefficient goes above or below its sensitivity range, the product mix will change. If the availability of one of the constraints goes above or below its sensitivity range, the product mix will change. Increased additive has no limit because there was a 4 lb surplus. Excel Solver Solution © 2013 Lew Hofmann
Homework #8 (The last one!) Three Problems I “highly” recommend using the POM/QM Program! Due This Friday!!!
Problem #1 A manufacturer of textile dyes can use two different processing routings for a particular type of dye. Routing 1 uses drying press A, and routing 2 uses drying press B. Both routings require the same mixing vat to blend chemicals for the dye before drying. The following table shows the time requirements and capacities of these processes. Each kilogram of dye processed on routing #1 uses 20 liters of chemicals, whereas each kilogram of dye processed on routing #2 uses only 15 litersdue to different yield rates of the drying presses. Consequently, the profit per kilogram on routing 1 is $50 and on routing 2 it is $65. A total of 450 liters of input chemicals is available. Write the objective function and constraints to maximize profits. Identify the optimal solution and any constraints with slack or surplus. © 2013 Lew Hofmann
Problem #2 The Trim-Look Company makes several lines of skirts, dresses, and sport coats. Recently, a consultant suggested that the company reevaluate its South Islander line and allocate its resources to products that would maximize contributions to profits and to overhead. Each product requires the same fabric and must pass through the cutting and sewing departments. The following data were collected for the study: The cutting department has 100 hours of capacity, sewing has 180 hours of capacity, and 60 yards of material are available. Each skirt contributes $5 to profits and overhead; each dress, $17; and each sport coat, $30. A.) Specify the objective function and constraints, and solve the problem. B.) How much would you be willing to pay for an extra hour of cutting time? Sewing time? An extra yard of material? © 2013 Lew Hofmann
Problem #3 Morgan Tools has a scheduling problem. Operators work eight-hour shifts and can begin work at midnight, 4 A.M., 8 A.M, noon, 4 P.M., or 8 P.M. However, these are 4-hour increments and workers must work eight hours. Thus the shifts overlap. EG: Workers coming on at 8 PM must work until 4 AM. Determine the minimumnumber of operators to start work (if any) at each of the six shifts. This problem doesnotinvolve costs. You are trying to schedule the fewest people possible while still covering the demand requirements. Thus your objective function is to Minimize costs using “1’s” as coefficients for each shift designation. In the data-entry matrix, the rows and columns are the shifts. You include or exclude a shift from a constraint row by using a “1” or a “0”. © 2013 Lew Hofmann