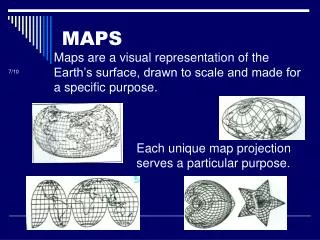
MAPS
MAPS. Drawing the World. Draw, without using any resources, a world map Be sure to include the following: Continents (label them) Oceans (label them) Equator Compass rose Prime Meridian International dateline Tropics of Cancer and Capricorn Arctic and Antarctic circles

MAPS
E N D
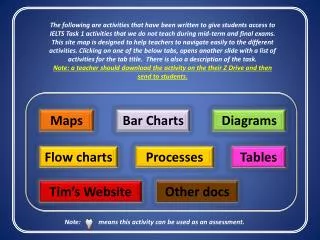
Presentation Transcript
Drawing the World • Draw, without using any resources, a world map • Be sure to include the following: • Continents (label them) • Oceans (label them) • Equator • Compass rose • Prime Meridian • International dateline • Tropics of Cancer and Capricorn • Arctic and Antarctic circles • Red, Mediterranean, and Black Seas • 3 largest mountain ranges in the world • Flight path between Washington D.C. and Iraq (non-stop)
Arctic International Dateline Prime Meridian Black Sea Rocky Mountains Mediterranean Himalayas Atlantic Pacific Sahara Desert Tropic of Cancer 23.5 Red Sea Equator Indian AndesMountains Tropic of Capricorn23.5
What’s a Map (by any other name)? • The world as a map • Complete questions 1-12 of the Latitude and Longitude Lab on page 3 of your packet
Latitude and Longitude 1. The lines running north-south represent degrees of____________________ which is measured from the ____________________ in a____________________ and ____________________direction. These lines are known also as____________________. 2. The lines running east-west represent degrees of____________________ which is measured from the ____________________in an ____________________and ____________________ direction. These lines are known also as____________________.
Latitude and Longitude, cont. 3. The geographic grid used on the globe is based on the division of a circle in ____________________ degrees. Each degree is divided into ____________________ equal parts called minutes, and each minute into ____________________ equal parts called____________________. 4. Latitude is numbered from ____________________ degrees at the equator to ____________________ degrees at either pole. 5. Longitude is numbered from ____________________ degrees at the prime meridian to ____________________ degrees at the International Date Line.
7. What are the coordinates of point A? _____________________ 8. Locate the same coordinates on a globe. In what country is point A located? _____________________ 9. What are the coordinates of point B? ____________________ 10. Locate the same coordinates on the globe. In what country is point B located? _____________________ 11. Locate a point at 10 ° South Latitude and 45 ° West Longitude. Mark it CB. 12. Locate a point at 20 ° North Latitude and 75 ° East Longitude. Mark it D.
Latitude and Longitude • Use the World Geography textbook to complete the Latitude and Longitude Lab. • The atlas is on pages A1-A25 • Homework: Types of Maps Research • Get the document off of my website! • Define and find examples of the five types of maps we will be working with throughout the semester I anticipate a quiz on “what is geography and how do we study it” on Tuesday…
February 5, 2013 • Agenda • Quiz – What is Geography and how do we study it? • Finish/Discuss Lat. & Long. Lab • The World in Spatial Terms, video • Discuss types of maps • Maps Lie! • U.S. Interstate Highway System (if time)
Geography is ______________________________________________________________________________________________ • Give the three essential questions we ask when studying geography.
We divide the study of geography into two categories. What are they? ________________________________ and ________________________________ • P.E.P.C. stands for…. • P_____________________ • E_____________________ • P_____________________ • C_____________________
Lat. & Long. Lab • Chicago: 42N, 87W • Rome: 42N, 12.5E • Shenyango: 42N, 123E or Beijing: 40N, 116E • Chicago Antipode: 42S, 93E; Australia; Perth
Lat. & Long. Lab • Milwaukee, WI: 43N, 87W • Quito, Ecuador: 0, 78W • Calcutta, India: 22N, 88E • London, England: 51N, 0 • Capetown, S. Africa: 34S, 18E • Moscow, Russia: 56N, 38E • Miami, FL: 25N, 80W
February 8, 2013 • Latitude-Longitude Quiz • How Maps Lie • Types of Maps • Using Topographic Maps • U.S. Interstate Highway System (if time)
Latitude-Longitude Quiz • Lines of Latitude measure degrees _____ & _____. • Lines of Longitude measure degrees _____ & _____. • Find the locations of the following: • Atlanta, GA • Paris, France • Cairo, Egypt • Hanoi, Vietnam
Maps Lie! • How? • Why? Distance Direction Human Bias 3D to 2D
Maps Lie! - Distance • Some areas are stretched (edges) while others are compressed (middle areas) • Most accurate where “paper” would touch the globe
Maps Lie! - Direction • North is not always the same direction • Even on the same map!
Types of Maps • What are the 5 types of maps we will be using? • ____________________________ • ____________________________ • ____________________________ • ____________________________ • ____________________________
Physical Maps • Colors used to show elevation • Colors blend into one-another
Political Maps • Countries are in different colors • Boundaries are clearly defined • Used to show governmental boundaries • Can be national, state, or local
Topographic Maps • Lines are used to show elevation • More lines = steeper slope • Colors used to show land features • Zoomed in maps show greater detail (i.e., roads)
Thematic Maps • Colors used to show specific information/data • Colors may cross borders • Distinct colors DO NOT blend
Cartograms • Thematic Maps • Distorted to demonstrate certain values • Area • Distance
February 12, 2013 • Agenda: • Achieves • Map Quiz • Understanding Topographic Maps • World Culture Regions
What does it look like from the side? Contour interval (Contour line) Looks like a view from the air. 10 20 30 Y 40 Lake ChaCha 50 Reference line X You would see this side of the landform. You are standing HERE at the 50 40 30 20 10 0 Bonus question: Why is it impossible for Lake ChaCha to exist there? Bonus question: What is the elevation at the X? And at the Y? Bonus question: What is wrong about the reference line when referring to a person at X?
February 14, 2013 • Agenda • Topographic Maps • World Culture Regions Map • Climate Reading
2500___________________________________________ 2250___________________________________________ 2000___________________________________________ 1 750___________________________________________ 1500___________________________________________ 1250___________________________________________ 1000___________________________________________ X
Culture Regions of the World • Geographers rarely discuss the world in terms of continents, or even hemispheres • When investigating human geography, we look at Culture Regions • What defines a culture region? • The people within a culture region share cultural characteristics – i.e., language, religion, or physical attributes.