Download
1 / 34
340 likes | 470 Vues
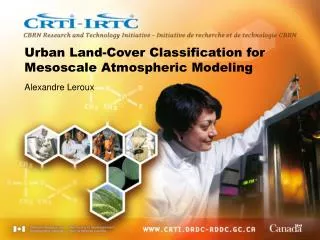
Urban Land-Cover Classification for Mesoscale Atmospheric Modeling. Alexandre Leroux, M.Sc., Ing. Canadian Meteorological Centre Environment Canada’s National Center for data assimilation and numerical weather prediction, climate and air quality modeling

E N D
Urban Land-Cover Classification for Mesoscale Atmospheric Modeling Alexandre Leroux, M.Sc., Ing.
Canadian Meteorological CentreEnvironment Canada’s National Center for data assimilation and numerical weather prediction, climate and air quality modeling • Environmental Emergency Response DivisionProvides highly specialized support to environmental emergencies including atmospheric dispersion and trajectory modeling
Context • High resolution atmospheric numerical models require detailed characterisation of the Earth’s surface to drive sophisticated surface parametrisation schemes. This requirement is even more important for complex urban environments
Objectives • Goal: Provide an urban land-cover database for North-American cities for mesoscale atmospheric modeling, specifically, for the Town Energy Balance scheme (TEB) • Mean: - Approach #1 (snapshot overview) Satellite imagery and DEM analysis - Approach #2 Vector data processing and DEM analysis
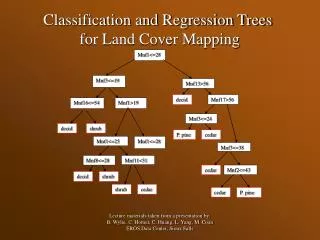
Satellite approach - Workflow Statistics and fractions at a lower scale Decision tree Results readied for atmospheric modeling Satellite imagery unsupervised classification Processing and analysis Building height assessment through SRTM-DEM minus CDED1 or NED
Input data processing and analysis • Satellite urban land-cover classification:Mid-resolution unsupervised classification of Landsat-7 and ASTER data • Building height appraisal: • SRTM-DEM for elevation at top of features (e.g. trees, buildings) • CDED1 (Canada) and NED (USA) for soil elevation • The subtraction evaluates the building height
Satellite approach results • Computed statistics and fractions are feed to the decision tree • Main results: • 12 new urban classes generated at 60m • +/- 5 vegetation classes • Processing and analysis: ~ 1 week / urban area • Results over OkC, Mtl and Van are satisfactory
National Topographic Data Base • Vector data with 110 thematic layers • e.g. water, vegetation, golf course, built-up areas, buildings (points and polygons), roads, bridges, railway, etc • Most layers with attributes • e.g. a road feature can be ‘highway’, ‘paved’, ‘underground’. • A total of 2474 1:50,000 sheets covering Canada • Available internally within the federal government
Statistics Canada - 2001 Census Data • Canada-wide coverage • Used to distinguish residential districts • Population density calculated using this dataset • Includes the number of residences • Available internally (license purchased by EC)
Topography and height data • SRTM-DEM • Top of features (e.g. buildings, vegetation) • Worldwide coverage and free • “Poor” spatial resolution (3 arc-second, ~90m) • CDED1 • Ground elevation • Canada-wide coverage and free • 1:50,000 (mtl: 16 x 23m) • Subtraction to evaluated building height
Scripted Spatial Data Processing Complete automation: • Automated dataset identification • Read/write multiple formats, including CMC custom formats • On-the-fly reprojection and datum management • Different spatial resolution / scale management • Spatial data cropping, subtraction (cookie cutting), buffering, rasterizing, SQL queries on attributes, multiple layer flattening (merge down), basic spatial queries, LUT value attribution and much more… • Makes use of GDAL and OGR open C libraries
Results • Results for Montreal and Vancouver • Raster output at 5m spatial resolution, generates rater data with 10,000 x 12,000 pixels (50 x 60 km, Toronto) • Other processed cities • Calgary, Edmonton, Halifax, Ottawa, Quebec, Regina, Toronto, Victoria, Winnipeg • The methodology, processing, analysis and results are well documented
TEB classes • 44 ‘final’ aggregated classes • Buildings (18 classes) • 1D & 2D, height, use (i.e. 24/7, industrial-commercial) • Residential areas, divided by population density (5 classes) • Roads and transportation network (6 classes) • Industrial and other constructions (5 classes) • e.g. tanks, towers, chimneys • Mixed covers (3 classes) • Natural covers (7 classes)
1 km Population density classes, Vancouver
1 km Transportation network, Vancouver
Detail of Montreal, Scaled-down, 44 classes 1 km
Detail of Vancouver, Scaled-down, 44 classes 1 km
Main benefits • Canada-wide applicability • Full data coverage • Approach directly applied anywhere over Canada • Complete automation • Single command with only one input parameter • One optional exception: SRTM-DEM minus CDED1 • Fast! From 3 min to 40 min for the whole processing • Numerous other advantages identified… • No interpretation and reduced human intervention • Flexible approach, code developed reusable • Spatial resolution of the results
Main limitations • Up-to-date data • NTDB data based on “old” aerial imagery: missing some downtown buildings and suburbs • Thematic representation • No layer corresponding to rural areas and parking lots • Almost no distinction in vegetation types • Various other minor limitations identified…
The future of the vector approach • Adaptation to CanVect and other datasets, potentially including US territory datasets • Use of 3D building models required for CFD modeling within the vector approach • Various other improvements envisioned… • TEB sensibility analysis to urban LULC databases • Scientific article to be written • much more…
Urban canyon modeling: linking mesoscale models to CFD models at the urban scale