Download
1 / 15
160 likes | 822 Vues
Evaluating Safe Yield for Supply Wells in an Aquifer with Fresh Water / Salt Water Interface. SWIM 2008. Gregory Nelson 1 , Liliana Cecan 1 , Charles McLane 1 , and Maura Metheny 1 1 McLane Environmental, LLC, Princeton, NJ USA. Introduction. Safe Yield

E N D
Evaluating Safe Yield for Supply Wellsin an Aquifer with Fresh Water / Salt Water Interface SWIM 2008 Gregory Nelson1, Liliana Cecan1, Charles McLane1, and Maura Metheny1 1McLane Environmental, LLC, Princeton, NJ USA
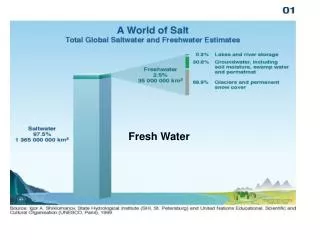
Introduction • Safe Yield • Aquifer Characterization for Safe Yield Analysis • Delineation of the Fresh Water / Salt Water Interface • Characterization of the Density Distribution • Characterization of the Horizontal and the Vertical Hydraulic Conductivity • Salinity Impact Safe Yield Analysis (Case Study) • Site Geology • Aquifer Characterization • Traditional Safe Yield • Salinity Impact Safe Yield • Conclusions / Recommendations
Safe Yield • Safe Yield: Manage the water resource by striking a balance between meeting community water demands while avoiding deleterious hydrologic and environmental impacts • Typical Methods • Specific capacity • Long-term pumping test (5 – 10 days) • Hydrologic impact limits
Safe Yield for a Coastal Aquifer • A safe yield analysis in coastal settings should take into consideration salinity impacts caused by pumping • Requires more detailed aquifer characterization • Requires application of a salinity transport model
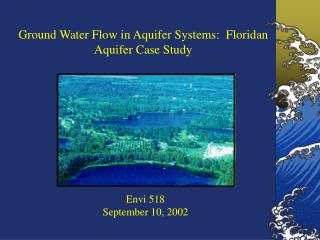
Aquifer CharacterizationDelineation of the Fresh Water / Salt Water Interface and Density Distribution Density distribution and an accurate delineation of the fresh water / salt water interface before, during pumping phase and during recovery phase of a pumping test yield important information in determining a safe yield for the well field
Aquifer CharacterizationCharacterization of the Horizontal and the Vertical Hydraulic Conductivity • Salt water intrusion and upconing is sensitive to horizontal and vertical hydraulic conductivity • Low vertical hydraulic conductivity below the pumping well will dampen upconing • Method: “Pumping Test Analyses in an Aquifer with Fresh Water/Salt Water Interface” – Liliana Cecan
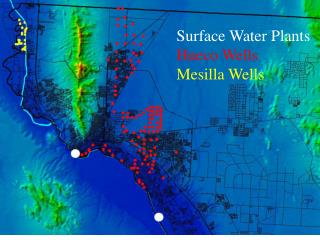
Safe Yield Analysis (Case Study)Cape Cod Site Geology • Glacial sediments deposited in a lacustrine deltaic system 15,000 years ago (Oldale 1992) • Glacial sediments extend 900 ft below ground surface to crystalline bedrock (Masterson 2004) • Aquifer system is composed of several fresh water lenses – the site lies in the Pamet Lens (Walter and Whealan 2004) • Average recharge is 24 in/yr (Masterson 2004) • Groundwater flow is radial toward the Atlantic Ocean (East), Cape Cod Bay (West), Pilgrim Lake (North), and Herring River (South)
Safe Yield Analysis (Case Study)Aquifer Characterization salt water interface transition zone boundaries
Safe Yield Analysis (Case Study)Traditional Safe Yield Available drawdown (dd): 20 ft Specific capacity (SC): 35 gpm / ft dd Safe Yield rate: SC x dd = 700 gpm ≈ 1 MGD
Safe Yield Analysis (Case Study)Salinity Impact Safe Yield • A pumping rate of 1 MGD causes fouling of the well within 50 yrs • A pumping rate of 0.7 MGD causes upconing, but the concentration does not exceed the MCL
Conclusions / Recommendations • Despite a growing awareness of salt water intrusion and upconing, safe yield pumping rate regulations still do not require assessment of potential salinity impacts caused by pumping • Accurate delineation of the interface and density distribution can be helpful in estimating a safe yield pumping rate in coastal aquifers • Proper characterizing of the horizontal and vertical hydraulic conductivity are essential in determining safe yield pumping rate estimates • The safe yield pumping rate estimated with consideration of salinity impacts is potentially lower then a rate estimated using traditional methods
References Masterson, J.P., 2004, Simulated interaction between freshwater and saltwater and effects of ground-water pumping and sea level change, Lower Cape Cod aquifer system, Massachusetts: U.S. Geological Survey Scientific Investigations Report 2004-5014, 72 p. Oldale RN (1992) Cape Cod and the Islands, the Geologic Story. Parnassus Imprints, East Orleans, Massachusetts, 208 p. Walter, D.A., and Whealan, A.T., 2004, Simulated water sources and effects of pumping to wells and surface waters, Sagamore and Monomoy flow lenses, Cape Cod, Massachusetts: U.S. Geological Survey Scientific Investigation Report 2004-5181, 85 p.
Acknowledgements The authors wish to thank Mark White of Environmental Partners Group and Andrew Miller of Head First for many hours of discussions that have helped to improve this paper. We’d also like to thank John Masterson of the U.S. Geologic Survey for discussions on the U.S.G.S. Cape Cod SEAWAT model. • For additional information please visit our web page at http://www.mclaneenv.com/sub_links/news.htm