Download
1 / 32
330 likes | 463 Vues
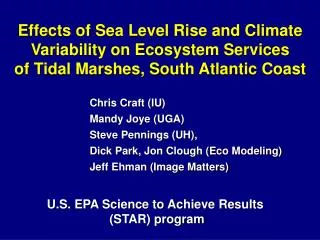
Effects of Sea Level Rise and Climate Variability on Ecosystem Services of Tidal Marshes, South Atlantic Coast. Chris Craft (IU) Mandy Joye (UGA) Steve Pennings (UH), Dick Park, Jon Clough (Eco Modeling) Jeff Ehman (Image Matters). U.S. EPA Science to Achieve Results (STAR) program.

E N D
Effects of Sea Level Rise and Climate Variability on Ecosystem Services of Tidal Marshes, South Atlantic Coast Chris Craft (IU) Mandy Joye (UGA) Steve Pennings (UH), Dick Park, Jon Clough (Eco Modeling) Jeff Ehman (Image Matters) U.S. EPA Science to Achieve Results (STAR) program
Land Sea Tidal fresh-water marsh Salt marsh Regulation Functions Shoreline Protection CO2 & CH4 Flux Carbon sequestration N&P retention Sediment Deposition Denitrification Habitat Functions Macrophyte Diversity Marsh Nekton Productivity Functions Macrophyte ProductivityMarshNekton
Research Questions • How will rising sea level affect abundance • and distribution of tidal wetlands AND • their delivery of ecosystem services? • How will climate variability (drought, • flood) affect delivery of ecosystem • services?
Rising sea level Increased inundation, salinity & sulfate Alteration of ………. Wetland Habitat Ecosystem Services ● Reduction of salt and brackish ● Reduced Regulation Functions marsh habitat (shoreline protection, CH4 & CO2 flux, carbon sequestration, N, P retention, sediment deposition denitrification) ● Complete loss of tidal fresh- ● Reduce Habitat Functions water marsh (plant diversity) ● Increased submerged land ● Reduced Production Functions (plant productivity, marsh nekton, commercial shrimp yield) Submerged Land
I. Sea Level Rise • Quantify ecosystem services of salt, brackish • and tidal fresh marshes. • Overlay ecosystem services on GIS map of • wetlands. • Simulate different scenarios of sea level rise to • predict change in wetland area, type and • ecosystem services. • Evaluate the effects of dikes versus no dikes. • Scale to South Carolina-Georgia coasts.
Figure 4. Study region, including the southeast (GA, SC) coast, field sampling areas (Altamaha, Satilla, Ogeechee Rivers) and GIS map of tidal wetlands of the Altamaha River estuary (GA).
SLAMM Version 5 (alpha) (Sea Level Affects Marshes Model) SLAMM uses elevation, NWI, tide range and historic sea level rise data to parameterize the model. The simulation is run using A1B SRES (mean) scenario.
2050 1986 2075 2100
Dry Land Hardwood Swamp Cypress Swamp Inland Fresh Marsh Year 2100 Tidal Fresh Marsh Transitional Salt Marsh Saltmarsh Estuarine Beach Tidal Flat Ocean Beach Inland Open Water Estuarine Open Water Open Ocean Brackish Marsh Tidal Swamp Freshwater Shore Initial Condition Year 2100
Init. Cond. Year 2100 Loss (ha) (ha) (%) --------------- -------------- ------- Dry land 49,000 38,800 21 Swamp 18,100 17,100 5 Tidal swamp 8,300 1,400 83 Fresh marsh 800 600 25 Tidal fr. marsh 4,000 1,500 75 Brack. marsh 10,700 11,100 +4 Salt marsh 25,100 19,700 38 Tidal flat 100 5,500 +9000
Net Change (1986-2100) Wetland Area C Sequestration (ha) (MT/yr) --------------- -------------- Tidal fresh-2,500 -3000 (120 g C/m2/yr) Brackish marsh +400 +480 (120 g C/m2/yr) Salt marsh -5,400 -1620 (30 g C/m2/yr)
II. Climate Variability Identify relationships between climate forcing functions (annual rainfall, temperature, discharge, salinity) and… temporal variation in ecosystem services (emergent biomass, epifauna, sediment deposition, accretion/subsidence and commercial shrimp harvest). (GCE LTER monitoring data, NMFS data)