Download
1 / 13
130 likes | 240 Vues
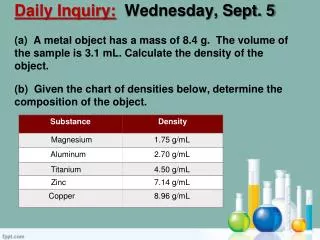
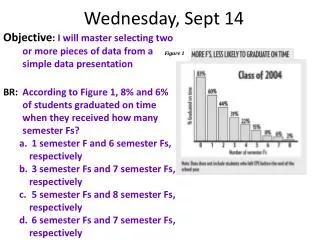
On September 14, we will focus on mastering the selection of data from a simple data presentation. According to the data presented in Figure 1, we analyze that 8% and 6% of students graduated on time based on the number of semester Fs received. We will explore various combinations of semester Fs (1 and 6, 3 and 7, 5 and 8, and 6 and 7) to determine how these impact graduation rates and strategies for academic success.

E N D
Wednesday, Sept 14 Objective: I will master selecting two or more pieces of data from a simple data presentation BR: According to Figure 1, 8% and 6% of students graduated on time when they received how many semester Fs? • 1 semester F and 6 semester Fs, respectively • 3 semester Fs and 7 semester Fs, respectively • 5 semester Fs and 8 semester Fs, respectively • 6 semester Fs and 7 semester Fs, respectively Figure 1
Wednesday, Sept 14 Objective: I will master selecting two or more pieces of data from a simple data presentation BR: According to Figure 1, 8% and 6% of students graduated on time when they received how many semester Fs? • 1 semester F and 6 semester Fs, respectively • 3 semester Fs and 7 semester Fs, respectively • 5 semester Fs and 8 semester Fs, respectively • 6 semester Fs and 7 semester Fs, respectively Figure 1
Wednesday, Sept 14 Objective: I will master selecting two or more pieces of data from a simple data presentation BR: According to Figure 1, 8% and 6% of students graduated on time when they received how many semester Fs? • 1 semester F and 6 semester Fs, respectively • 3 semester Fs and 7 semester Fs, respectively • 5 semester Fs and 8 semester Fs, respectively • 6 semester Fs and 7 semester Fs, respectively Figure 1
Wednesday, Sept 14 Objective: I will master selecting two or more pieces of data from a simple data presentation BR: According to Figure 1, 8% and 6% of students graduated on time when they received how many semester Fs? • 1 semester F and 6 semester Fs, respectively • 3 semester Fs and 7 semester Fs, respectively • 5 semester Fs and 8 semester Fs, respectively • 6 semester Fs and 7 semester Fs, respectively Figure 1
Wednesday, Sept 14 Objective: I will master selecting two or more pieces of data from a simple data presentation BR: According to Figure 1, 8% and 6% of students graduated on time when they received how many semester Fs? • 1 semester F and 6 semester Fs, respectively • 3 semester Fs and 7 semester Fs, respectively • 5 semester Fs and 8 semester Fs, respectively • 6 semester Fs and 7 semester Fs, respectively Figure 1 Last chance to view bell ringer – 1 min
Wednesday, Sept 14 BR: According to Figure 1, 8% and 6% of students graduated on time when they received how many semester Fs? • 1 semester F and 6 semester Fs, respectively • 3 semester Fs and 7 semester Fs, respectively • 5 semester Fs and 8 semester Fs, respectively • 6 semester Fs and 7 semester Fs, respectively Figure 1
Wednesday, Sept 14 BR: According to Figure 1, how many F’s should you get to give you the highest chance of graduating on time? • 0 or 1 • 1 or 2 • 3 or 4 • 7 or 8 Figure 1