Single Molecule Fluorescence
Single Molecule Fluorescence. Bulk experiment. Single macromolecule, several fluorophores. Single fluorophore. fluorescence cuvette, fluorophore ~10 -6 M. 10 15 molecules. Advantages of Single-Molecule Fluorescence. Distribution. # molecules. E FRET , r, I f.

Single Molecule Fluorescence
E N D
Presentation Transcript
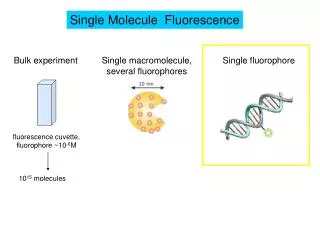
Single Molecule Fluorescence Bulk experiment Single macromolecule, several fluorophores Single fluorophore fluorescence cuvette, fluorophore ~10-6M 1015 molecules
Advantages of Single-Molecule Fluorescence Distribution # molecules EFRET, r, If Bulk experiment gives the same result in the 3 cases: the average value
DonorIntensity AcceptorIntensity Biochemical reactions can be monitored by temporal changes in ensemble FRET only if the reaction can be prepared in one state before initiating the reaction by an external trigger. Dynamics D A
The study of single molecules can also detect rare transitions that are difficult to detect using bulk techniques. molecule #1 Measured property molecule #2 molecule #3 time
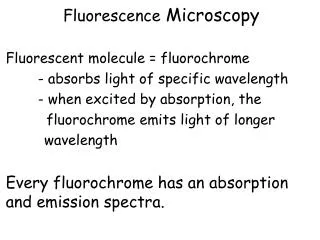
A single dye molecule can report on the host molecule to which it is attached to in a number of ways. Observables quencher • Fluorescence intensity and/or lifetime: Molecular-scale motion that brings a quencher in and out of close range of the fluorophore can be detected as a temporal fluctuation of the fluorescence intensity of lifetime. Fluorescence Intensity time • Energy transfer: A small change in the distance between two sites of a biological molecule where the donor and acceptor are attached can result in a sizeable change in the efficiency of transfer. Structural changes of biological molecules or relative motion and interaction between two different molecules can be detected by changes in FRET.
• Fluorescence polarization: The temporal variation in dipole orientation of a rigidly attached probe can provide information on the angular motion of the macromolecule. Dye attachment via a flexible linker can be used to provide information on changes in its mobility. fluorophore is fixed with respect to the macromolecule fluorophore rotation in ns-timescale
Fluorescence Anisotropy absorption transition dipole moment emission transition dipole moment I// I excitation polarizer emission polarizer Polarization:
I// I Probability of absorption and emision is proportional to cos2 I /I=3 r= 0.4 Fluorescence Anisotropy Fluorescence anisotropy r = 1 Single molecules fixed during the measurement I I// Bulk experiment -0.5 < r < 1 (or single molecule experiment where the molecule rotates freely in the time-scale of the measurement (>1ms) ) I// I r = -0.5
Effect of rotational diffusion Fluorescence anisotropy I// I ns-timescale Depends on viscosity, temperature, specific interactions with the environment, shape and volume of fluorophore. Rotational diffusion depolarizes the emission 1<I /I<3 0<r< 0.4=r0 assuming that the absorption and emission dipole moments are parallel • Bulk experiment • Single molecule experiment where the molecule rotates freely in the time-scale of the measurement (>1ms)
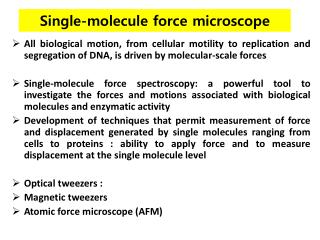
Detection of Single Molecules In order to be able to detect fluorescence from single molecules, the detected signal must exceed the signal from impurities in the solvent, glass coverslips, and optical components, as well as the signal associated with the dark current of the detector. Therefore, it is necessary to use a small excitation volume to reduce the background, high-efficiency collection optics, and detectors with high quantum efficiency and low dark noise. Confocal scanning optical microscope Point detection using APDs (avalanche photodiodes). Good time resolution and sensitivity. Observation of only one molecule at the time. Wide field microscopy two-dimensional detectors such as CCD cameras. Several single-molecules can be detected simultaneously. Sensitivity and time-resolution not as good.
Basement membrane labeled with cy2 (green)Neurons labeled with cy3 (red) http://www.atto.com/Carv/CarvSkinSection.htm
c i = r n1 n2 t= 90º Total internal Reflection reflected ray Evanescent waves are formed when sinusoidal waves are (internally) reflected off an interface at an angle greater than the critical angle so that total internal reflection occurs. The intensity of evanescent waves decays exponentially (rather than sinusoidally) with distance from the interface at which they are formed. i = r n1 n2 t refracted ray n1.sin c = n2 n1.sin i = n2.sin t http://micro.magnet.fsu.edu/primer/techniques/fluorescence/tirf/olympusaptirf.html
In fluorescence mode, having focused on the beads, the bead fluorescence is very difficult to distinguish because of the obscuring background fluorescence from the cheek cells. In TIRFM imaging mode, the image contrast is dramatically high, and beads can be observed easily.
Confocal microscopy Total internal reflection CCD APD 1 color beam splitter or polarizing beam splitter APD 2 laser sample mounted on a piezo scanner laser photobleaching counts per second time
+ - Fluorophores and biological constructs Ideal dyes for SMF have to possess as many as possible from the following characteristics: -photostability - high fluorescence quantum yield - high extinction coefficient - small intensity fluctuations - absorb and emit in the visible - small size to introduce minimum perturbations to the host molecule. Cy3 (570 nm) Cy5 (650 nm) O2 scavengers reduce photobleaching: TAMRA (570 nm) glucose oxidase Glucose gluconic acid H2O2 H2O + 1/2 O2 O2 H2O2 catalase Alexa Fluor 488 (520 nm)
Immobilization of macromolecules to glass surfaces The most exciting promise of single-molecule fluorescence studies is the observation of conformational dynamics of biological molecules. This requires a long observation time and hence some form of immobilization of the molecules. If performed improperly, immobilization can perturb the integrity of the molecule. biotin-streptavidin biotinylated macromolecule streptavidin glass surface biotinylated BSA > Ni-NTA (Nickel-nitrilotriacetic acid)- 6xHis tagged proteins > antidigoxigenin- digoxigenin
Recent applications of SMF to biophysical research Fluorescence from single diffusing molecules Detection of fluorescence from fluorescein-labeled ss-DNA diffusing through a focused laser beam: (a) Tris buffer solution; (b) 1.6 × 10⁻¹⁰ M; (c) 1.6 × 10⁻⁹ M. R6G dissolved in Tris buffer and in a 50/50 mixture of buffer and glycerol J. Phys. Chem. B,104 (6), 1382 -1390, 2000
Ratiometric single-molecule studies of freely diffusing biomolecules Ashok A Deniz, Ted A Laurence, Maxime Dahan, Daniel S Chemla, Peter G Schultz, and Shimon Weiss.Annu. Rev. Phys. Chem. 2001. 52:233-253.
Fluorescence from single immobilized molecules Protein-induced conformational changes of single RNA molecules measured using FRET. (a) An RNA three-helix junction folds upon the specific binding of ribosomal protein S15. Donor (D) and acceptor (A) dyes attached to two arms of the junction move closer to each other when the protein binds and FRET increases. The RNA junction was attached to a surface in a specific way using a well-known `molecular glue', biotin¯streptavidin binding. (b) Fluorescence images of donor and acceptor dyes from dozens of single RNA molecules were obtained simultaneously. The donor image was colored green and the acceptor image was colored red, and their overlay image is shown. Green spots are due to protein-free RNA molecules and red spots, with high FRET, represent protein-bound, folded RNA
Real-time observation of single RNA molecule conformational changes on buffer exchange. Time traces (integration time, 5 ms) of donor (solid line) and acceptor signal (dotted line) on buffer exchange. [Mg2+] was alternated between 0 and 1 mM every 200 ms (starting from 0). Significant donor signal reduction is seen every time Mg2+ buffer is present. Vertical grids denote buffer exchange periods (400 ms). Three-point averaging was applied to reduce noise. Donor photobleaching is marked by an arrow. Ligand-induced conformational changes observed in single RNA molecules Taekjip Ha, Xiaowei Zhuang, Harold D. Kim, Jeffrey W. Orr, James R. Williamson, and Steven Chu, PNAS Vol. 96, Issue 16, 9077-9082, August 3, 1999
F1FO-ATPase: ATP ADP + Pi V H time • Stepping rotation of F1-ATPase visualized through angle-resolved single-fluorophore imaging.Proc Natl Acad Sci U S A 2000 Jun 20;97(13):7243-7 • Adachi K, Yasuda R, Noji H, Itoh H, Harada Y, Yoshida M, Kinosita K Jr.
The fluorophore Cy3 attached to the subunit of F1-ATPase revealed that the subunit rotates in themolecule in discrete 120° steps and that each step is driven bythe hydrolysis of one ATP molecule (A) Sequential fluorescence images, at 167-ms intervals, of a single Cy3-F1 molecule. V, vertically polarized fluorescence; H, horizontally polarized fluorescence. (B) Time courses of spot intensities for V and H in A. (C) Time courses of the polarization, P = (VH)/(V + H), and total intensity, I = V + H, calculated from B. The fluorophore photobleached at 55 s. Dashed lines (a, b, and c) are calculated P for the three orientations in D: P = 0.4 × [sin2( + 18°) cos2( + 18°)], where = 0°, 120°, and 240°.
Recommended reviews Single-Molecule Fluorescence Resonance Energy Transfer Methods: A Companion to Methods in Enzymology vol. 25, No. 1, September 2001 pp. 78-86. Single-molecule fluorescence methods for the study of nucleic acidsTaekjip Ha CURR OPIN STRUC BIOL 11 (3): 287-292 JUN 2001 Measuring conformational dynamics of biomolecules by single molecule fluorescence spectroscopy Shimon Weiss Nature Structural Biology Vol.7 Number 9- September 2000. Fluorescence Spectroscopy of Single BiomoleculesShimon WeissScience March 12 1999 pp.1676-1683