Single molecule Biophysics HW
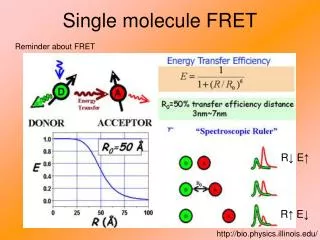
Single molecule Biophysics HW. The R 0 values for the fluorophores used in many biological FRET experiments range around 6 nm. If this is the case, how far apart do the donor and acceptor have to be for the efficiency to be 10%, 50%, 90%?


Single molecule Biophysics HW
E N D
Presentation Transcript
Single molecule Biophysics HW • The R0 values for the fluorophores used in many biological FRET experiments range around 6 nm. If this is the case, how far apart do the donor and acceptor have to be for the efficiency to be 10%, 50%, 90%? • An RNA molecule that can exist either in a compact, folded conformation or an open conformation is studied by single-molecule FRET. The Förster radius is 6.5 nm for the used fluorophores. • The efficiency of transfer is observed to fluctuate erratically between 0.9 and 0.2. Estimate distances between donor and acceptor in these two states • Data on “dwell time” in the high-transfer (folded) state have been accumulated for long-time observation on a number of molecules: Calculate the rate of unfolding from these data. Is it a first order process? • We talked about the stretching of a chain of immunoglobulin-like proteins in class. The force-extension curve shows a particular saw-tooth pattern. • Suggest an explanation for such behavior. • What would you expect to change if you pulled faster? What assumption did you use?
How would you expect the force-elongation curve for a single-stranded DNA would compare with that for double stranded DNA as shown in class. A qualitative answer with a plot will suffice (can consult original papers) • An AFM can be operated in contact mode and tapping mode. • Briefly describe each mode (diagram). • What is used as the feedback signal in those modes? • Which exerts less lateral force on the sample? • Fibrin fibers are the basic components of a blood clots and their mechanical properties are thus of great biomedical interest. Until we started doing our experiments, people had only a very vague idea of the mechanical properties of those fibers. We have combined an inverted fluorescence microscope with an Atomic force microscope to measure the mechanical properties of those fibers. Basically, we are taking stress-strain curves of fibrin fibers. The fiber is “suspended” over a groove and anchored on the ridges (see movie). The tip of the AFM is then used to stretch out the fiber while this process is observed with the optical microscope from underneath. • What is the advantage of using a combined AFM/inverted optical microscope instead of just using an AFM to record the stress-strain curves? • What is the difference between a plastic and elastic deformation? Looking at one of the overlaid stress-strain curves in class (push 1 and push 2) up to (at least) which point to fibers deform elastically? • What is the Young’s modulus of fibrin fibers?
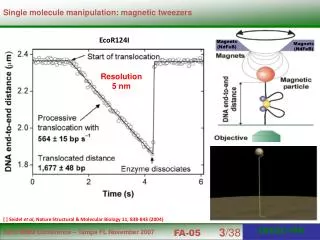
Single molecule biophysics • Observation and physical manipulation of single, dynamic biomolecules (not just static EM images). • A recently emerged new field, offering much deeper analysis of molecular behavior. • All previous studies have been on the average, ensemble behavior of molecules. • Why study single molecules? • How any one molecule behaves is not revealed in bulk studies. • An individual enzyme may exist in two or more states of activity that are not revealed by bulk studies. (e.g speed of RNA polymerase transcription). • Analogy: How insurance actuary and novelist look at human behavior. • Static heterogeneity: Different enzyme molecules function at different rates (e.g. a lame population and a fast population) • Dynamic heterogeneity: A given single enzyme can switch between different rates. • Can take force measurements (force spectroscopy) on single molecules (previously impossible). E.g. motor proteins, unfolding-refolding proteins
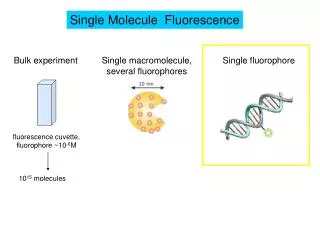
Single-molecule vs. bulk measurements • Bulk measurements: average of measured quantity is obtained. • Single molecule measurement: distribution of measured quantity is obtained.
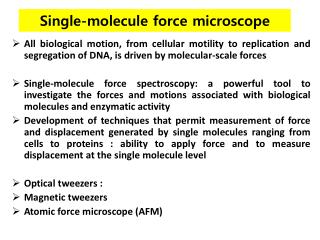
Single molecule biophysics Three techniques: • Atomic Force Microscopy (AFM) (observe and mechanically manipulate single molecules). • Laser traps (observe (indirectly) and mechanically manipulate single molecules). • Single molecule fluorescence. (observe single molecules).
Photodetector Laser Cantilever Piezo-electric transducer Sample Substrate Force controlled by feedback Schematic of an AFM Images from NT-MDT web page
Atomic Force Microscopy • Advantages: • Can achieve atomic resolution on hard, crystalline surfaces • Can often achieve nanometer resolution on biological samples • Imaging can be done in buffer can image (biological) processes. • Can also be used to mechanically manipulated molecules (more in a few slides). AFM image of gold surface (atomic resolution)
Tapping 4 nm On Off On Off 0 nm On Off On 2 mm scan Contact mode AFM scan Tapping mode AFM Contact mode (constant force mode): Use cantilever deflection as feedback signal, (use softer cantilevers, can still have lateral forces pushing molecules around) Tapping mode: oscillated cantilever at its resonance frequency (10 kHz to 300 kHz), use cantilever amplitude or phase as feedback signal. (Lateral forces mostly eliminated).
Imaging of DNA in buffer DNA diffuses on surface (imaged in liquid)
100 nm Transcribing RNA Polymerase Imaged by SFM T = 0 s T = 80 s T = 130 s T = 170 s A B C D T = 210 s T = 250 s T = 290 s 5.0 nm E F G 0 nm Kasas et al. (1997) Biochemistry 36(3), 461-468 Guthold et al. (1999) Biophys. J. 77, 2284-2294
Lateral force vs. normal force measurements Normal force (pulling) Lateral force Measurement: Disadvantages: Disadvantages: • lower sensitivity (difficult to measure pN). • Force measurement is limited by tip-sample (surface-sample) attachment • Sample cannot be imaged Advantages: Advantages: • Can measure large force without having to worry about tip-sample attachment • No tip-sample-substrate attachment necessary • Often used for tip-surface friction measurements • Can image sample before and after manipulation • sample-surface and tip-surface interactions are typically not interfering with force measurement • high sensitivity (can measure pN forces) Cantilever gets twisted: Cantilever gets bent:
Lateral Force Measurement A B fiber Laser Tip Photo diode q Tip hits fiber Partial surface Detachment Deformation Rupture Translocation Sample Fr Scan direction Ds Fs Lateral force Ft Tip position
Laser Photo diode q Cantilever Sample Objective lens Force measurements and visualization A combined Atomic Force-Fluorescence Microscope
Breaking strength Maximum extension Stress-strain curves of single fibrin fibers • How do fibers respond to force?? • What is the maximum extensibility? • Do fibers deform elastically or plastically? • If they are elastic, what is the Young’s modulus, E?
What are Fibrin Fibers? • Fibrin fibers are the major structural component of blood clots • Biomedical importance: • wound healing • wound sealing after surgery • heart attacks and strokes (#1 and #3 cause of death in US) • Delicate balance between • excessive clotting (thrombotic patients, heart attacks, strokes) • weak clots (hemophiliacs or hemorrhagic patients): Image: M. Kaga, P. Arnold; Voet&Voet, “Biochemisty”, Wiley & Sons, NewYork, 1990 Blood clots have the mechanical task of stemming the flow of blood
Stress-strain curves on single, uncross-linked fibrin fibers Stress (N/mm) Area under curve is equal to work done on fiber. strain
Normal force measurements. Example 1. Protein unfolding (a) The principal AFM components. (b) Mechanical unfolding of repeating immunoglobulin-like domains (1). As the distance between the surface and tip increases (from state 1 to state 2), the molecule extends and generates a restoring force that bends the cantilever. When a domain unfolds (state 3), the free length of the protein increases, relaxing the force on the cantilever. Further extension again results in a restoring force (state 4). The last peak represents the final extension of the unfolded molecule before detachment from the SFM tip (state 5). • Carrion-Vazquez et al. “Mechanical and chemical unfolding of a single protein: a comparison” (1999) PNAS 96 3694-99 • Figure from Bustamante, Macosko, Wuite “Grabbing the cat by the tail: Manipulating molecules one by one. Nature reviews Molecular Cell Biology1 131-6
Normal force measurements. Example 2. Ligand binding forces and how they related to the koff rate (force spectroscopy). • Protein-ligand is spanned between the tip and the substrate. • The tip is then retracted, and, thus, applying a force to the bonds under investigation. • If the force is measured as a function of the pulling rate, it is termed force spectroscopy.
Connection between rupture force and off-rate k-1 Bell model: an applied force lowers the activation energy. Assume a two-state model for the reaction. Dissociation rate without an applied force: Dissociation rate with applied force: G. Bell (1978) Science200, 616-627; E. Evans & K Ritchie (1997) Biophys. J.72, 1541-55
Connection between rupture force and off-rate, k-1 Experiment: Measure rupture force as a function of pulling rate. (here done of two different proteins). For this treatment, we assume the reaction proceeds far from equlibrium. The faster you pull the higher the rupture force. The rupture force is related to the off-rate F … rupture force T … temperature k-1 … off-rate x-1 … width of potential kB …Boltzmann constant Data from F. Schwesinger et al. (2000) PNAS97, 9972-77, First done by Rief at al. Science (1997) 276, 1109-12
How does a laser trap work? • Light “consists of photons, which carry momentum. Momentum is conserved. When light is absorbed, reflected or refracted, tiny forces on the order of piconewtons are generated. • For a laser trap we need a light gradient (light is focused). • Opposing scattering and gradient forces, trap a bead in the focus. • If moved from the focus, bead is pulled back toward the focus. Laser beam lens Bead is below center of focus force on bead toward focus • Particle radius has to be larger than wavelength of light (Mie scattering regime). • Need transparent dielectric bead with index of refraction larger than surrounding medium. Fscatt. Fgrad
Ray-diagram for a bead to the left and higher than laser focus Restoring force of a laser trap A trap exerts a linear restoring force proportional to trap stiffness (force is linear to displacement). Using optical tweezers, one can apply pico-newton sized loads and measure nanometer level displacements. From Hubmayr lab, Mayo Clinic): http://mayoresearch.mayo.edu/mayo/research/hubmayr/
Laser tweezers • Force clamp: Force on molecule is kept constant by always having bead at the same position in laser trap ( feedback loop moving bead or stage). • Position clamp: Position of molecule is kept constant bead is pulled out of trap and, thus, force increases.
Applications of laser tweezers • Transcription by single RNA polymerase. Set-up for measuring force-velocity relation of a transcribing RNA polymerase (Wang et al. (1998) Science282, 902-7. Stall force is about 20 nN.
From Block lab: http://www.stanford.edu/group/blocklab/RNAP.html Applications of laser tweezers • Transcription by single RNA polymerase. Individual RNA polymerase molecules switch between a fast and a slow mode (Davenport et al. (2000) Science287, 2497-500 Dumbbell set-up used for some experiments
Mechanical properties of DNA • Stretching of double-stranded l-phage DNA; Length for B DNA ~ 16 mm). • Up to a length of about 15 mm: worm-like chain is straightened (entropy), little force needed. • Steep part of curve corresponds to elastic stretching of extended chain. • At ~ 17 mm a major conformational change occurs conversion to S-DNA (stretched-DNA). • Then DNA denatures and becomes single-stranded. From Smith et al. (1996) Science271, 795
A few more applications • Force-producing properties of various molecular motors, including kinesin moving along microtubules 13, actomyosin complexes 28, RNA polymerase 36, 48 and DNA polymerase 11 (Fig. 4b). Mechanical properties of DNA 47 • Mechanical unfolding of proteins 52, 53 • Unfolding of RNA molecules (54) • For a somewhat recent review see: Bustamante et al. “Grabbing the cat by the tail: Manipulating molecules one by one.” (2000) Nature reviews Molecular Cell Biology1 131-6
11. Wuite, G. J., Smith, S. B., Young, M., Keller, D. & Bustamante, C. Single-molecule studies of the effect of template tension on T7 DNA polymerase activity. Nature404, 103-106 (2000). | Article | PubMed | ISI | ChemPort | • 13. Svoboda, K., Schmidt, C. F., Schnapp, B. J. & Block, S. M. Direct observation of kinesin stepping by optical trapping interferometry. Nature365, 721-727 (1993). | Article | PubMed | ISI | ChemPort | • 28. Essevaz-Roulet, B., Bockelmann, U. & Heslot, F. Mechanical separation of the complementary strands of DNA. Proc. Natl Acad. Sci USA94, 11935-11940 (1997). | Article | PubMed | ChemPort | • 47. Smith, S. B., Cui, Y. & Bustamante, C. Overstretching B-DNA: the elastic response of individual double-stranded and single-stranded DNA molecules. Science271, 795-799 (1996). | PubMed | ISI | ChemPort | • 48. Yin, H. et al. Transcription against an applied force. Science270, 1653-1657 (1995). | PubMed | ISI | ChemPort | • 52. Kellermayer, M. S., Smith, S. B., Granzier, H. L. & Bustamante, C. Folding-unfolding transitions in single titin molecules characterized with laser tweezers. Science276, 1112-1116 (1997); erratum 277, 1117 (1997). | PubMed | ISI | ChemPort | • Tskhovrebova, L., Trinick, J., Sleep, J. A. & Simmons, R. M. Elasticity and unfolding of single molecules of the giant muscle protein titin. Nature387, 308-312 (1997). | Article | PubMed | ISI | ChemPort | • (J. Liphardt et al. “Reversible Unfolding of Single RNA Molecules by Mechanical Force” (2001) Science292, 733-737
Single molecule fluorescence • Like Chapter 11, except on a single molecules • Using one (or few) fluorophores • Two big problems: • Photobleaching: Most fluorophores photobleach, i.e. after absorbing many photons ( usually a few million), they chemically rearrange and stop fluorescing. • Must have very, very clean sample.
Experimental considerations • The molecule must contain (or be labeled with) a strong fluorophore (high absorbance and Q-yield). • Need intense light source (usually laser). • Need a very sensitive camera/detector • Need to reduce all background light. • Illuminate a very small region only, or • Use TIR (total internal reflection). • (On white board): From Snell’s law : When light encounters a lower index of refraction medium the light gets totally reflected when the incident angle is larger than the critical angle. We get an evanescent wave (evanescent = tending to vanish like vapor).
Prism-based TIR illumination Distance above cover slip Relative light intensity 132 nm 0.125 No signal (background) from molecules far from surface. 88 nm 0.25 Laser 44 nm 0.5 Only molecules close to surface will fluoresce Microscope objective Prism and cover slip TIRF No TIRF n1 …index of refraction of glass slide n2 …index of refraction of water q … incident angle l … wavelength of light
Objective-based TIRF illumination Ray paths (schematic): Total reflection1: Objective, 2: Immersion oil n = 1.518, 3: Cover slip n = 1.518, 4: Evanescent field, 5: Mountant n = 1.33…1.38 Angle of incidence smaller than the critical angle. www.zeiss.com See applet and info at: http://www.olympusmicro.com/primer/techniques/fluorescence/tirf/tirfhome.html
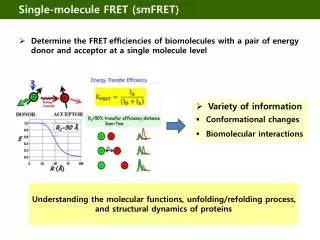
Application: Single molecule FRETG. Bokinsky et al. “Single-molecule transition-state analysis of RNA folding” (2003) PNAS 100: 9302 The hairpin ribozyme: The docking and undocking conformations and a single molecule FRET trace: SA
Application: Single molecule FRETG. Bokinsky et al. “Single-molecule transition-state analysis of RNA folding” (2003) PNAS 100: 9302 • From figure on previous page: • The ribozyme exhibits fluctuations between two states, docked and undocked FRET signal changes abruptly when a transition occurs. • Rate constants can be extracted from dwell times!! • They found a single rate constant for docking kd = 0.018 sec-1. • They found four different rate constants for undocking • (ku = 0.01, 0.1, 0.8, 6 sec-1), which would have been hard to find in bulk studies). For single rate. Occurence Dwell time in docked state