Single molecule detection ( LAMDA-P )
Single molecule detection ( LAMDA-P ). Nanoplasmonic tweezers.

Single molecule detection ( LAMDA-P )
E N D
Presentation Transcript
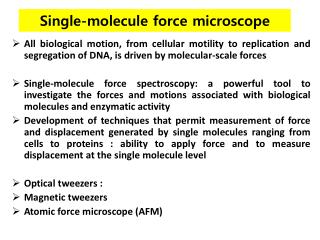
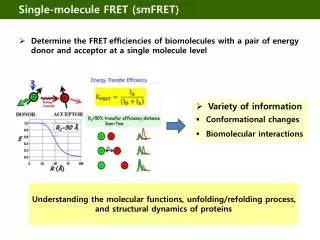
Nanoplasmonic tweezers • Conventional optical trapping using a tightly focused beam is not suitable for trapping particles that are smaller than the diffraction limit because of the increasing need of the incident laser power that could produce permanent thermal damages. • One of the current solutions to this problem is to intensify the local field enhancement by using nanoplasmonic structures without increasing the laser power. • Nanoplasmonic tweezers can be used to trap various small molecules. • Surface plasmon resonance (SPR) is the collective oscillation of electrons in a solid or liquid stimulated by incident light. • The resonance condition is established when the frequency of light photons matches the natural frequency of surface electrons oscillating against the restoring force of positive nuclei. • SPR in nanometer-sized structures is called localized surface plasmonresonance (LSPR).
Content: experiment procedure • Prepare PDMS microchamber • Preparation of PDMS mixture • Removal of PDMS vapor • Spin coating PDMS mixture • Solidification of PDMS film • Prepare specimen • Implementation of tapping single molecule experiment
Composition to make PDMS microchamber • Electric scale • Hot plate • Desiccator • PDMS materials • Spin coater • Disposable gloves • Disposable pipet • Tweezers • Mixture plate • Dish
Preparation of PDMS mixture Turn on and set the scale to “0”. Put the plate on the electronic scale and set the scale to “0” again.
Preparation of PDMS mixture cont. Pour SylgardA/B in the plate at the ratio of 10:1. Total amount is set 10 g. Mix Sylgard A/B well to make PDMS mixture for about 2 min..
Removal of PDMS vapor • When mixing PDMS mixture, the vapor is created. If the vapor is not removed, the quality is decreased. Firstly, put the plate including PDMS mixture in the desiccatorand turn on the vacuum pump. Amount of PDMS mixture should be less than 10 g. If not, the mixture will be overflowed from the plate. After removing the vapor, turn off the vacuum pump.
Spin coating PDMS mixture When spin coating, the plate is stained with the solutions. These solutions are not removed from the plate easily due to high viscosity. That’s why the plate and chuck of spin coater should be covered by aluminum foil, before spin coating.
Spin coating PDMS mixture cont. After setting the program, put the plate on the chuck. For fixation of the plate, press “vacuum” button to give vacuum.
Spin coating PDMS mixture cont. Pour the prepared PDMS mixture on the substrate adequately. At this moment, make sure that the vapor should not be created. Start to spin coating by pressing “start” button. After finishing spin coating, turn off vacuum and main power.
Spin coating PDMS mixture cont. • When spin coating, the thickness of PDMS film is defined by rpm and time. Please refer following graph to make PDMS microchamber you want.
Solidification of PDMS film • Move the plate thinly coated by PDMS mixture to the hot plate. Tosolidifythe PDMS mixture, apply heat for 10 min. at 120 °C.
Content: experiment procedure • Prepare PDMS microchamber • Preparation of PDMS mixture • Removal of PDMS vapor • Spin coating PDMS mixture • Solidification of PDMS film • Prepare specimen • Implementation of tapping single molecule experiment
Nanoholes fabrication on the gold plate • Nanoholes can be fabricated by focused ion beam (FIB) from NNFC in KAIST. • To confirm the efficiency of plasmonic phenomenon at which size of hole, fabricate various different size (210 ~ 450 nm) of hole on the gold plate.
Prepare specimen • Prepare PDMS substrate, DNA solution and gold plate. • Make the chamber on the PDMS substrateby cutter. • Pour the DNA solution in the PDMS microchamber. • Put the gold plate on the substrate
Content: experiment procedure • Prepare PDMS microchamber • Preparation of PDMS mixture • Removal of PDMS vapor • Spin coating PDMS mixture • Solidification of PDMS film • Prepare specimen • Implementation of tapping single molecule experiment
Preparationoftrappingexperiment The trapping experiment is implemented in LAMDA-H system. Put the specimen on the sample stage and turnon the all instruments. Operate HOT and Lab VIEW program. Find the fabricated nanoholes by controlling motorized stage.
Measurement of trapping signal by APD If you find nanoholes, turn on the laser . Laser focus is exactly located on the target nanohole by controlling piezo stage. The exact position can be confirmed by APD signal. Increased the scattering signal up to maximum as you can by controlling the piezo stage at vicinity of the target nanohole. If done, you’re ready to measure the trapping signal.
Measurement of trapping signal by APD cont. Turn off the laser and set the storage path. Most of area is covered by gold (metal) excluding holes. When the laser is emitted, heat absorption problem is happened by gold plate. The absorption vaporizes the medium including DNA molecules. However, the medium influences on the laser scattering. That’s why scattering signal should be measured within 2 min., after turning on the laser.
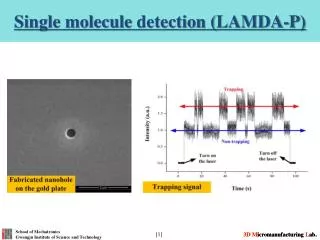
Analysis of measured trapping signal • After the laser is turned on, the scattering signal rises up to line B and then rises for the second time to line A. Afterwards, the measurement oscillates only between the two lines. We can deduce that the higher value at line A is due to the increased signal by trapping the DNA. If measuring time is increased by maintaining the quantity of medium in experiment environment.