1. Motivation
Predicting survival using gene expression data and graphical models. F M-S Barthel 1 , V Didelez 2 , J Hein 3 1 Department of Biostatistics, Institute of Psychiatry, King’s College London, sophie@fm-sbarthel.de

1. Motivation
E N D
Presentation Transcript
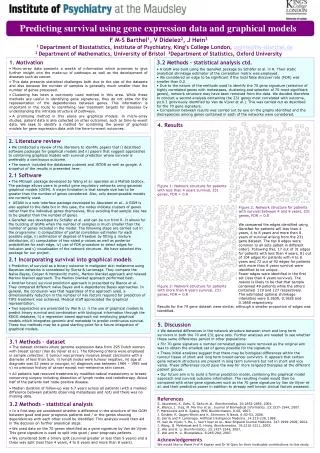
Predicting survival using gene expression data and graphical models F M-S Barthel1, V Didelez2, J Hein3 1 Department of Biostatistics, Institute ofPsychiatry, King’s College London, sophie@fm-sbarthel.de 2 Department of Mathematics, University of Bristol 3Department of Statistics, Oxford University • 1. Motivation • Micro-array data presents a wealth of information which promises to give further insight into the make-up of pathways as well as the development of diseases such as cancer. • This data presents statistical challenges both due to the size of the datasets and also because the number of samples is generally much smaller than the number of genes processed. • Clustering has been a commonly used method in this area. While these methods are useful in identifying gene signatures, they do not allow for the representation of the dependencies between genes. This information is important in the route to identifying new treatment targets for diseases by understanding the intricate structure of pathways. • A promising method in this arena are graphical models. In micro-array studies, patient data is also collected on other outcomes, such as time-to-event data. We seek to identify a method for combining the power of graphical models for gene expression data with the time-to-event outcomes. • 3.2 Methods – statistical analysis ctd. • A GGM was built using the GeneNet package by Schäfer et al. in R. Their static analytical shrinkage estimator of the correlation matrix was employed. • We considered an edge to be significant if the local false discover rate (FDR) was smaller than 0.2. • Due to the nature of the methods used to identify the 70 gene signature (selection of highly correlated genes with metastases, clustering and selection of 70 most significant genes), network structure may have been removed from the data. We decided therefore to conduct a second analysis containing the 231 genes most correlated with outcome, ρ≥0.3 (previously identified by Van de Vijver et al.). This was carried out as described for the 70 gene signature. • Comparison between results was carried out by eye on the graphs identified and the discrepancies among genes contained in each of the networks were considered. 4. Results Figure 1: Network structure for patients with less than 4 years survival, 231 genes, FDR = 0.8 Figure 2: Network structure for patients with survival between 4 and 8 years, 231 genes, FDR = 0.8 We compared the edges identified using GeneNet for patients will less than 4 years, 4 to 8 years and more than 8 years of survival arising from the 231 gene dataset. The top 8 edges were common to all sets (albeit in different order). Following this, 17 out of 31 edges for patients with less than 4 years, 81 out of 104 edges for patients with 4 to 8 years and 72 out of 92 edges for patients with more than 8 years survival were identified to be unique. Fewer edges were identified in the first set (less than 4 years survival). The reason is likely to be that that sample Figure 3: Network structure for patients contained 49 patients while the others with more than 8 years survival, 231 contained 119 and 127 respectively. genes, FDR = 0.8 The estimated optimal shrinkage intensities were 0.3639, 0.1628 and 0.1868 respectively. Results for the 70 gene dataset were similar, although a smaller proportion of edges was identified. • 2. Literature review • We conducted a review of the literature to identify papers that i) described software packages for graphical models and ii) papers that suggest approaches to combining graphical models with survival prediction where survival is preferably a continuous outcome. • The search included the databases pubmed and JSTOR as well as google. A snapshot of the results is presented here: • 2.1 Software • The MGraph package developed by Wang et al. operates as a Matlab toolbox. The package allows users to predict gene regulatory networks using gaussian graphical models (GGM). A major limitation is that sample size has to be greater than the number of genes considered. Also, only decomposable models are currently used. • ASIAN is a web-interface package developed by Aburatani et al.. A GGM is also applied to the data but in this case, the nodes indicate clusters of genes rather than the individual genes themselves, thus avoiding that sample size has to be greater than the number of genes. • GeneNet was developed by Schäfer et al. and can be run from R. It allows for the building of GGMs when the number of samples is much smaller than the number of genes included in the model. The following steps are carried out in the programme: i) computation of partial correlation estimates for each possible edge, ii) estimation of degrees of freedom by fitting a mixture distribution, iii) computation of two-sided p-values as well as posterior probabilities for each edge, iv) use of FDR procedure to select edges for inclusion and v) visualisation of the network structure. We have selected this package for our project. • 2.1 Incorporating survival into graphical models • Prediction of survival as a binary outcome in malignant skin melanoma using Bayesian networks is considered by Sierra & Larranaga. They compare the Naïve Bayes, Cooper & Herskovitz metric, Markov blanket approach and relaxed Markov blanket approach. The Markov blanket approach performed best. • Another binary survival prediction approach is presented by Blanco et al.. They compared different naïve Bayes and k-dependence Bayes approaches. In general, the conclusion was that regardless of the approach used, a dimensionality reduction in the number of risk factors required for prediction of TIPS treatment was achieved. Medical staff appreciated the graphical representation. • Two approaches are presented by Wei & Li: i) the use of graphical models to predict binary survival and combination with biological information through the KEGG database, ii) a regression based approach not employing graphical models which integrates genomic and metadata to predict continuous survival. These two methods may be a good starting point for a future integration of graphical models. • 5. Discussion • We detected differences in the network structure between short and long term survivors in both the 70 and 231 gene sets. Further analyses are needed to see whether these same differences persist in other populations. • For 70 gene signature a number correlated genes were removed as the original aim was to obtain the smallest set of genes possible for the signature. • These initial analyses suggest that there may be biological differences within the tumour tissue of short and long term breast cancer survivors. It appears that certain gene network structures are present in long term survivors but not in short and vice versa. These differences could pave the way for more targeted therapies at the different patient groups. • Our future aim is to build a formal prediction model, combining the graphical model approach and survival outcome information. The resulting model would then be compared with other gene signatures such as the 70 gene signature by Van de Vijver et al. and their predictive power in addition to already well known clinical factors assessed. • 3.1 Methods – dataset • The dataset contains whole genome expression data from 295 Dutch women with breast cancer (Van de Vijver et al.). The following criteria were employed in sample collection: i) tumour was primary invasive breast carcinoma with a diameter of less than 5cm, ii) lymph nodes were tumour negative, iii) age at diagnosis was 52 years or younger, iv) diagnosis was between 1984 – 1995 and v) no previous history of cancer except non-melanoma skin cancer. • All patients had received treatment by modified radical mastectomy or breast-conserving surgery including dissection of lymph nodes and radiotherapy. About half of the patients had node-positive disease. • Median duration of follow-up was 6.7 years across all patients (with a marked difference between patients observing metastases and not) and there was no missing data. • 3.2 Methods – statistical analysis • In a first step we considered whether a difference in the structure of the GGM between good and poor prognosis patients and / or the genes showing dependencies with each other could be identified. This analysis would then aid in the decision on further analytical steps. • We used data on the 70 genes identified as a gene signature by Van de Vijver. This gene signature is used to split into good / poor prognosis patients. • We considered both a binary split (survival greater or less than 5 years) and a three way split (less than 4 years, 4 to 8 years and more than 8 years). References S. Aburatani, K. Goto, S. Saito et al.. Bioinformatics. 20:2853-2856, 2004. R. Blanco, I. Inza, M. Merrino et al.. Journal of Biomedical Informatics. 23:1537-1544, 2007. F. Markowetz and R. Spang. BMC Bioinformatics. 8:S5, 2007. J. Schäfer, R. Opgen-Rhein and K. Strimmer. R News. 6:50-53, 2006. B. Sierra and P. Larranaga. Artificial Intelligence Medicine. 14:215-230, 1998. M. Van de Vijver, Y. He, L. Van’t Veer et al.. New England Journal Medicine. 347:1999-2009, 2002. J. Wang, O. Myklebost and E. Hovig. Bioinformatics. 19:2210-2211, 2003. Z. Wei and H. Li. Bioinformatics. 23:1437-1544, 2007. Z. Wei and H. Li. Biostatistics. 8:265-284, 2007. Acknowledgements We would like to thank Prof R Kaplan and Dr W Qian for their invaluable contributions to this study.