Enhancing PM2.5 Datasets Using NASA Satellite AOD for Health Studies
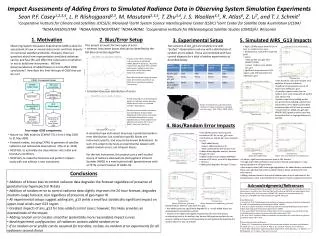
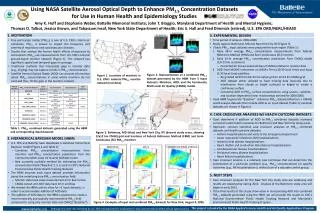
This research explores the integration of NASA's Satellite Aerosol Optical Depth (AOD) data to enhance PM2.5 concentration datasets, addressing significant gaps from ground-based monitoring networks. By combining AOD with measurements from the U.S. EPA’s monitoring network and CMAQ modeling, this study aims to improve the spatial and temporal representation of PM2.5 exposure. The methodology includes hierarchical Bayesian modeling and case crossover analyses to assess impacts on human health outcomes in Baltimore and New York City, specifically concerning respiratory and cardiovascular diseases.

Enhancing PM2.5 Datasets Using NASA Satellite AOD for Health Studies
E N D
Presentation Transcript
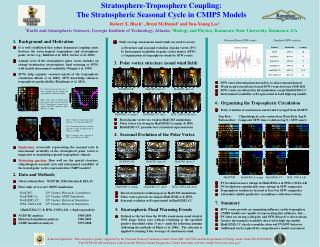
Using NASA Satellite Aerosol Optical Depth to Enhance PM2.5 Concentration Datasets for Use in Human Health and Epidemiology Studies Amy K. Huff and Stephanie Weber, Battelle Memorial Institute; John T. Braggio, Maryland Department of Health and Mental Hygiene; Thomas O. Talbot, Jessica Brown, and Tabassum Insaf, New York State Department of Health; Eric S. Hall and Fred Dimmick (retired), U.S. EPA ORD/NERL/HEASD 1. MOTIVATION 3. EXPERIMENTAL DESIGN • Fine particulate matter (PM2.5) is one of U.S. EPA’s criteria air pollutants. PM2.5 is known to impact the frequency and severity of respiratory and cardiovascular diseases. • Studies that analyze the human health effects of exposure to atmospheric PM2.5 use measurements from U.S. EPA’s national ground-based monitor network (Figure 1). This network has significant spatial and temporal gaps in coverage. • Traditional methods that interpolate gaps in monitor data (e.g., kriging) may not capture trends in PM2.5 concentrations. • Satellite Aerosol Optical Depth (AOD) can provide information about PM2.5 concentrations in areas where monitors do not exist and thus, fill the gaps in the monitor network. • Time period of analysis: 2004-2006 • Study regions: Baltimore, MD and New York City, NY (Figure 3) • 3 basic PM2.5 input datasets were prepared for each region (Table 1): • Daily 24-hr average PM2.5 concentration measurements from Federal Reference Method (FRM) and Semi-Continuous (SC) monitors • Daily 24-hr average PM2.5 concentration predictions from CMAQ model (12×12 km resolution) • Corrected for known seasonal bias of CMAQ relative to monitor data • AOD from MODIS instrument on NASA’s Terra (10:30 local time) and Aqua (1:30 local time) satellites: • Re-gridded AOD from 10×10 km native grid to 12×12 km CMAQ grid • AOD dataset either allowed to have missing data (typically due to interference from clouds or bright surfaces) or kriged to create a continuous surface • Converted AOD to PM2.5 surface concentrations using season-, satellite-, and location-dependent linear relationships derived for 2004-2006 • Used HBM to generate “Baseline” reference PM2.5 dataset (Monitors + CMAQ) and 8 analysis datasets that include AOD as an input dataset (Table 1); example datasets are shown in Figure 4. Figure 2. Representation of a combined PM2.5 dataset generated by the HBM from 3 input datasets: Monitors, AOD, and the Community Multi-scale Air Quality (CMAQ) model. Figure 1. Locations of monitors in U.S. EPA’s national PM2.5 monitor network (red dots). 4. CASE CROSSOVER ANALYSES W/ HEALTH OUTCOME DATASETS • Goal: determine if addition of AOD to PM2.5 combined datasets increases correlation with health outcomes for Baltimore and New York City study areas. • Approach: conduct statistical case crossover analyses on PM2.5 combined datasets and health outcome datasets: • Asthma hospitalizations and visits to the Emergency Department • Acute myocardial infarctions (MI) hospitalizations • Ischemic heat disease hospitalizations • Heart rhythm and conduction disturbances hospitalizations • Cerebrovascular disease hospitalizations • Peripheral artery disease hospitalizations • Heart failure hospitalizations • Case crossover analysis is a relatively new technique that can determine the contribution of a particular predictor (e.g., PM2.5 concentrations) on specific outcomes (e.g., MI hospitalizations), without use of a separate control group. Table 1. PM2.5 combined datasets generated using the HBM and corresponding input datasets. Figure 3. Baltimore, MD (blue) and New York City, NY (brown) study areas, showing 12x12 km CMAQ grid and locations of Federal Reference Method (FRM) and Semi-Continuous (SC) PM2.5 monitors. 2. HIERARCHICAL BAYESIAN MODEL (HBM) • U.S. EPA and Battelle have developed a statistical hierarchical Bayesian model (Figure 2 and Table 1): • Combines PM2.5 concentration measurements from monitors and PM2.5 concentration predictions from the Community Multi-scale Air Quality (CMAQ) model • Best currently available method for estimating the PM2.5 concentration field (“Baseline”); it is used in CDC’s National Environmental Public Health Tracking Network • The HBM assumes each input dataset provides information about the underlying true PM2.5 concentration field: • Monitor data have some measurement error but no bias • CMAQ output and AOD data have error and bias • We revised the HBM code to allow for >2 input datasets, in order to accommodate addition of AOD data. • The addition of AOD data to the HBM is expected to create a more temporally and spatially representative PM2.5 field compared to using only monitor data and CMAQ (“Baseline”). AOD (1) COMBINED AOD (KRIGE) & CMAQ (8) BASELINE (B) µg/m3 µg/m3 µg/m3 Monitors Monitors Monitors 5. NEXT STEPS • Case crossover analyses for the New York City study area are underway and results are expected by Spring 2013. Analysis of the Baltimore study area will begin in early 2013. • If the final results of this study show value in incorporating AOD into combined PM2.5 datasets generated using the HBM, we will provide the results to CDC’s National Environmental Public Health Tracking Network and Maryland’s Environmental Public Health Tracking Program. CMAQ CMAQ Aqua AOD Terra AOD Combined AOD (krige) Figure 4. Examples of input and combined PM2.5 datasets for New York, August 4, 2005. This project is funded by the NASA Applied Sciences Health and Air Quality Applications Program. Although this work was reviewed by U.S. EPA and approved for publication, it may not necessarily reflect official Agency policy.