Download
1 / 33
330 likes | 361 Vues
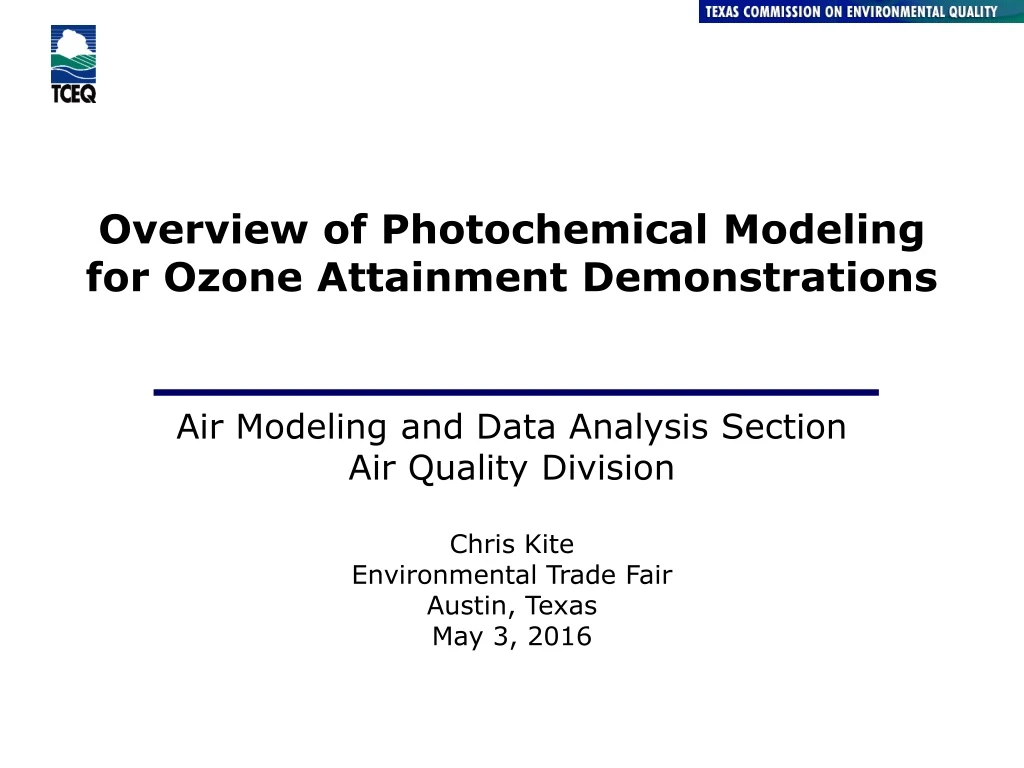
Overview of Photochemical Modeling for Ozone Attainment Demonstrations. Air Modeling and Data Analysis Section Air Quality Division Chris Kite Environmental Trade Fair Austin, Texas May 3, 2016. Air Quality Division. National Ambient Air Quality Standards.

E N D
Overview of Photochemical Modelingfor Ozone Attainment Demonstrations Air Modeling and Data Analysis Section Air Quality Division Chris Kite Environmental Trade Fair Austin, Texas May 3, 2016 Air Quality Division
National Ambient Air Quality Standards • The United States (U.S.) Environmental Protection Agency (EPA) is required by the Clean Air Act to establish National Ambient Air Quality Standards (NAAQS) for pollutants considered harmful to health and the environment (https://www.epa.gov/criteria-air-pollutants/naaqs-table). • The NAAQS for ozone have changed over time: • 0.08 parts per million (ppm) one-hour precursor standard established in 1971; • 0.12 ppm one-hour ozone standard established in 1979; • 0.08 ppm eight-hour ozone standard established in 1997; • 0.075 ppm eight-hour ozone standard established in 2008; • 0.070 ppm eight-hour ozone standard established in 2015; and • units of parts per billion (ppb) are often used for reporting purposes, such as 70 ppb, 75 ppb, and 84 ppb. • The air quality monitoring network operated by each state is used to determine if an area is meeting the NAAQS.
Why Conduct Photochemical Modeling for Ozone Attainment Demonstrations? • Serious and above ozone nonattainment areas (and multi-state Moderate nonattainment areas) are required to use photochemical grid modeling to demonstrate attainmentin their State Implementation Plan (SIP). • Moderate nonattainment areas are required to use photochemical modeling as well. • An alternative approach can be used for Moderate nonattainment areas if the Administrator determines that it is at least as effective. • Model results are used to determine the amount of nitrogen oxides (NOX) and/or volatile organic compounds (VOC) emission reductions that may be needed for the area to attain the NAAQS. • EPA has specified approved models and has issued guidance, which is available on their SIP Attainment Demonstration Guidance Web page at https://www3.epa.gov/scram001/guidance_sip.htm. • Two EPA guidance documents applicable to modeling ozone are currently available: • a finalized version from April 2007; and • a draft update from December 2014 that has not yet been finalized.
Dallas-Fort Worth (DFW) Trends in Regulatory Ozone Design Values and Population from 1991 through 2015
DFW Area Regulatory Ozone DesignValues byMonitor from 2003 and 2015 • Notes: • Regulatory ozone design value (DVR) per monitor in units of parts per billion (ppb). • Result on left in green is the 2003 DVR from 2001, 2002, and 2003 monitored data. • Result on right in purple is the 2015 DVR from 2013, 2014, and 2015 monitored data. • Red monitor is current maximum. • Blue monitor is current minimum. • NA indicates monitor was not operational from 2001-2003. Pilot Point NA / 79 Denton Airport South 97 / 83 Greenville NA / 64 Frisco 88/ 76 Eagle Mountain Lake 96 / 76 Grapevine Fairway 100 / 78 Rockwall Heath 81 / 70 Dallas North #2 86 / 75 Keller 100 / 76 Parker County 89 / 75 Dallas Hinton Street 90 / 75 Fort Worth Northwest 96 / 80 Arlington Municipal Airport NA / 67 Dallas Executive Airport 85 / 68 Kaufman 73 / 67 Midlothian Old Fort Worth Road NA / 68 Granbury 84 / 73 Cleburne Airport 90 / 73 Italy NA / 66 Corsicana Airport NA / 66
Wind Direction Impacts on PeakOzoneLevels in the DFW Area Ozone Season Winds Highest frequency direction of wind on high ozone days. • Ozone design values have typically been set in the north and northwest part of the DFW area and follow the typical wind pattern shown above. • The location where the design valuesare set generally remains the same, but the intensity has dropped over time.
Fourth Highest Eight-Hour Ozone Levels at Five Northwest DFW Monitors from 2001 through 2015
Eight-Hour Ozone Regulatory Design Values at Five Northwest DFW Monitors from 2003 through 2015 Monitored regulatory ozone design value: three-year rolling average of the fourth highest reading per year. Example: The 2015 monitored design value is a truncated average of the fourth highest monitored levels from 2013, 2014, and 2015.
Photochemical Modeling Steps toDemonstrate Attainment of the Ozone Standard • Attainment of the 2008 75 ppb eight-hour ozone standard for a moderate nonattainment area like DFW will be determined by the average of the fourth-highest ozone readings per year from 2015-2017 for each regulatory monitor, which will result from: • background ozone levels and precursor emissions entering the area; • local and regional meteorological conditions that will occur; and • the magnitude, spatial distribution, and temporal distribution of NOXand VOC emissions. • Photochemical modeling is a computer tool used to predict future ozone levels based on the projected level of precursor emissions. Basic steps: • Episode: Select a representative historical ozone episode, with preference given to full cycles with transition from low to high and back to low ozone days. • Base Case: Develop modeling inputs for this episode that include meteorological fields, biogenic emissions, anthropogenic emissions, boundary conditions, initial conditions, etc. • Performance: Evaluate performance of the episode by comparing with historically monitored data. • Baseline Case: Run the base case meteorology and biogenic emissions with daily average inputs. For example, the base case has specific EGU emission measurements by day; the baseline has a seasonal representative average day instead. • Future Case: Develop daily average anthropogenic emission inputs for the future year accounting for expected growth and benefits of known federal, state, and local rules. • Attainment Test: For each ozone monitor, obtain a future design value (DVF) by applying the future/baseline modeled ozone ratio to a baseline design value (DVB), which is an average of the regulatory design value (DVR) over a three-year period.
Days at DFW Regulatory Monitors per Month from1991 through 2014 with Ozone Levels Above 75/84 ppb
DFW Maximum Monitored Eight-Hour OzoneMay 31 through July 2, 2006 Episode
DFW Maximum Monitored Eight-Hour OzoneAugust 13 through September 15, 2006 Episode
48-Hour Back Trajectories from Denton Airport SouthMonitor: May 31 through July 2, 2006 Episode Days Greater than 75 ppb Episode Days Less than 75 ppb
48-Hour Back Trajectories from Denton Airport SouthMonitor: August 13 through September 15, 2006 Episode Days Greater than 75 ppb Episode Days Less than 75 ppb
29 4x4 kilometer (km) Grid Cell “Boxes” from0 to 18,233 meters Above Ground Level (AGL)
Roughly 1,750 Surface Level 4 km Grid Cells (35x50) Needed to Cover Greater DFW Area Notes: Red dots indicate the location of each Continuous Air Monitoring Stations (CAMS) located throughout the DFW area.
North American Regional Domains forTexas Air Quality Modeling Efforts
Base Case Episode Development in TenTime-Consuming and Not-So-Easy Steps
2006 Summer Weekday Anthropogenic NOX EmissionsTexas 4 km Domain – June 14 Episode Day Area Total = 4,524 NOXtpd
2006 Summer Weekday Anthropogenic NOX EmissionsTexas 12 km Domain – June 14 Episode Day Area Total = 11,494 NOXtpd
2006 Summer Weekday NOX Emission Estimates forNorth American 36 km Domain – June 14 Episode Day Area Total = 61,454 NOXtpd
Changes in DFW Area NOX and VOCEmission Estimates by Source Category from 2006 to 2018
2018 Future Ozone Design Value (DVF) per DFW Area Monitor:Results for All Days and Top 10 Days Attainment Tests • Notes: • Result on left in green is the 2018 DVF based on the all days test. • Results on right in purple is the 2018 DVF based on the top 10 days test. • Monitor in red indicates the maximum projected DVF. • Monitor in blue indicates the minimum projected DVF. • Monitors in orange began operation after 2006. Pilot Point 66 / 65 Denton Airport South 76 / 75 Greenville 62 / 62 Frisco 73 / 72 Eagle Mountain Lake 75 / 74 Grapevine Fairway 75 / 73 Rockwall Heath 65 / 65 Dallas North #2 71 / 70 Keller 75 / 73 Parker County 71 / 71 Dallas Hinton Street 68 / 67 Fort Worth Northwest 73 / 72 Arlington Municipal Airport 69 / 68 Dallas Executive Airport 70 / 70 Kaufman 62 / 62 Midlothian OFW – 62 / 62 Tower – 67 / 66 Granbury 67 / 67 Cleburne Airport 70 / 68 Italy Activated in 2007 Corsicana Airport Activated in 2009
Key Provisions and Differences Between April 2007 and December 2014 EPA Modeling Guidance Documents • EPA Guidance on the Use of Models and Other Analyses for Demonstrating Attainment of Air Quality Goals for Ozone, PM2.5, and Regional Haze, April 2007: http://www3.epa.gov/ttn/scram/guidance/guide/final-03-pm-rh-guidance.pdf • Section 2.3 (page 17): “The results of corroboratory analyses may be used in a weight of evidence determination to show that attainment is likely despite modeled results which may be inconclusive.” • Table 2.1 (page 17): 82-87 ppb is the weight of evidence range for the 84 ppb standard, which equates to a 73-78 ppb weight of evidence range for the 75 ppb standard. • Section 2.4 (page 18): “We recommend a modeled attainment test in which model predictions are used in a relative rather than absolutesense.” • Sections 2, 3, and 4 (pages 15-42): Include all episode days in the baseline modeled above a specific threshold (e.g., 75 ppb) in the relative response factor (RRF) attainment test. • EPA Draft Modeling Guidance for Demonstrating Attainment of Air Quality Goals for Ozone, PM2.5, and Regional Haze, December 2014: http://www3.epa.gov/ttn/scram/guidance/guide/Draft_O3-PM-RH_Modeling_Guidance-2014.pdf • Section 4.9.3 (page 190): “A fully-evaluated, high-quality modeling analysis that projects future design values that are close to the National Ambient Air Quality Standards (NAAQS).” • Section 4.0 (page 95): “The recommended test uses model estimates in a relative rather than absolutesense to estimate future year design values.” • Section 4.2.1 (page 100): “Model response to decreasing emissions is generally most stable when the base ozone predictions are highest.” • Section 4.2.1 (page 100): “On days with high ozone concentrations, there is a relatively high percentage of locally generated ozone compared to days with low base case concentrations.” • Section 4.2.1 (page 101): “Use of the highest 10 days in the mean RRF calculation yields a slightly better estimate of the actual observed ozone change than the previous guidance approach.”
Monitor Specific Ozone Design Values –Regulatory versus Baseline • Regulatory design value (DVR) for the monitor: • Fourth highest ozone reading per year averaged (and truncated) over the three previous years. • The 2006 DVR is based on the fourth-highest reading from 2004, 2005, and 2006. • Baseline design value (DVB) for the monitor: • Average of the DVR from the year of the ozone episode plus the two subsequent years. • The 2006 DVB is an average of the 2006 DVR, 2007 DVR, and 2008 DVR. • The 2006 DVB for the Denton Airport South ozone monitor is 93.33 ppb:
Ozone Attainment Test Differences -All Days versus Top 10 Days Methodologies • To reduce uncertainty associated with model predictions, use of absolute modeled differences by individual grid cell and/or episode day should be avoided. • Instead, the relative change in modeled ozone concentrations across several days from two scenarios (e.g., baseline and future year) should be applied to real-world monitored values. • To calculate the RRF for the ozone attainment test: • EPA modeling guidance from April 2007 specifies averaging the results for all episode days in the baseline modeled above the standard, such as 75 ppb. • EPA draft modeling guidance from December 2014 specifies averaging the results for the 10 episode days in the baseline with the highest modeled levels. • Example calculations for the Denton Airport South Monitor:
Sample RRF Calculation for Attainment TestJune 9 Episode Day at Denton Airport South • The highest eight-hour ozone level measured during 2006 at the Denton Airport South monitor was 106 ppb on Friday June 9. • RRF calculation for June 9 episode day at Denton Airport South: • From the baseline modeled output, identify the maximum eight-hour ozone level in a 3x3 grid cell array centered around the monitor: 112.99 ppb • From the same 3x3 array, identify the maximum from the future case modeled output: 89.80 ppb • Divide the future case maximum by the baseline maximum to obtain the RRF: 89.80 ÷ 112.99 = 0.7948 • April 2007 guidance for all days test specifies use of the maximum array value in the future case. • December 2014 draft guidance for top 10 days test specifies use of specific grid cell value in the future case that had the maximum in the baseline.
2006 Baseline and 2018 Future Case Modeled Ozone at Denton Airport South Monitor
Electronic File Availability for Ozone Modelingand Emissions Inventory Development
Questions? Chris Kite Chris.Kite@tceq.texas.gov 512-239-1959