Analyzing Interactions Between Aphid and Ant Populations Over 20 Years
This article explores the relationship between aphid and ant populations based on a given graph. It examines statements supported by the graph, including population dynamics, expected trends after 20 years, and potential inter-species relationships such as predator-prey dynamics. By interpreting the data, we aim to understand the implications of these interactions on the populations' growth and decline, drawing reasonable conclusions and hypotheses about their ecological relationships.

Analyzing Interactions Between Aphid and Ant Populations Over 20 Years
E N D
Presentation Transcript
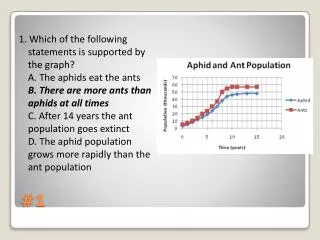
1. Which of the following statements is supported by the graph?A. The aphids eat the antsB. There are more ants than aphids at all timesC. After 14 years the ant population goes extinctD. The aphid population grows more rapidly than the ant population #1
2. Based on the graph, after 20 years the ant population would be expected to be closest toA. 60 B. 50 C. 120 D. 60,000 E. 120,000 #2
3. Which of the following is a reasonable conclusion from the graph of aphid and ant populationsA. An increase in the aphid population causes the ant population to growB. An increase in the ant population causes the aphid population to growC. There is a correlation (a relationship) between the ant and aphid populationsD. There is no relationship between the ant and aphid populations • We’d need to do a controlled study to cause #3
Predator/prey (more food= more growth) (but we would probably see more changes) • Mutualism – both species benefit each other • Commensalism – one species benefits, the other is unaffected • Mimicry – predators are scared of aphids because they look like ants #4 Possible Relationships
If we add more aphids, then the ant population will grow • If we remove the aphids, then the ant population will drop • If we do not allow the ants to eat the aphids, then the ant population will decrease • If we remove the aphids, then … #5
6. Based on the graph, in what year does the lion population NOT grow?A. 1990-1991B. 1991-1992C. 1994-1995D. 1995-1996E. The lion population grows every year #6
7. If the trends continued past 1998, when would we expect the cheetah population to reach 0? A. 1999 B. 2003 C. 2011 D. 2015 E. 2020 #7
8. The graph suggests the possibility of which type of inter-species relationship?A. Mutualism B.MimicryC. Competition D.Commensalism • Growth of lion population seems to be lowering the cheetah population. Possibilities: • Lions eat cheetahs • Lions are parasites on cheetahs • Lions compete for the same resources #8
9. Which of the following hypotheses would gain support from the above graph?A. Cheetahs eat lions – opposite could occurB. Cheetahs and lions occupy the same niche (compete for resources)C. Cheetahs and lions engage in a symbiotic relationshipD. The lion population has reached it’s carrying capacity #9
10. A biologists develops the hypothesis that the decreasing cheetah population allows the lion population to grow because there is more space available for lions to inhabit. Write a prediction that could be tested. Briefly describe a controlled experiment you could conduct. • If we limited the lions habitat, then the population would shrink #10
11. In the experiment above, which of the following was a control?A. The amount of light that reached each tank – this is the experimental variable, being changedB. The oxygen saturation of each tankC. The temperature of each tank –it is the same in every trialD. The gender of the animals placed in each tank #11
12. Which of the following is a reasonable conclusion from the experiment?A. The more light a community is exposed to, the more its populations will growB. The most productive amount of light exporsure for the community is 8 hours per dayC. Extra light seems to help plants but harm animalsD. Too much light must kill minnows. #12
13. What is the most likely explanation for the mass of the beta fish in the tanks exposed to less than 8 hours of light?A. There was not enough light for them to surviveB. There wasn’t enough energy for them to survive – the 10% rule. Not enough minnows to support a beta fishC. There wasn’t enough oxygen for them to surviveD. There wasn’t enough space for them to survive #13
14. If there were 2 beta fish in the 12-hour and 20-hour tanks, how many were likely in the 16 hour tank?A. 1 B. 2 C. 3 D. 4 • 2 fish have a mass of 1.5g (ish) • So each fish has a mass of 0.75g ish • If there are 2.4g in the tank… • Then there are probably about 3 fish with a mass of about 0.8g #14
15. Both scientists agree thatA. Individual lions became faster during their lifetimeB. Only the fastest lions can surviveC. The fossil population changed over time into the modern population aka EVOLUTION!D. The more an antelope looks for lions, the better its eyes will get #15
16. A study shows that the more an individual uses their eyes,the worse their vision gets. This evidence would argue against the view ofA. Neither scientist B. Scientist 1 C. Scientist 2 D. Both scientists #16
17. This situation is an example of which of the following?A. Mimicry B. Mutualism C. Succession D. Coevolution • The evolution of one species often affects evolution of another #17