Download
1 / 57
640 likes | 1.04k Vues
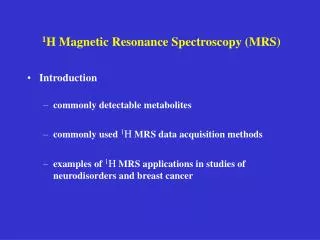
1 H Magnetic Resonance Spectroscopy (MRS). Introduction commonly detectable metabolites commonly used 1 H MRS data acquisition methods examples of 1 H MRS applications in studies of neurodisorders and breast cancer. Introduction.

E N D
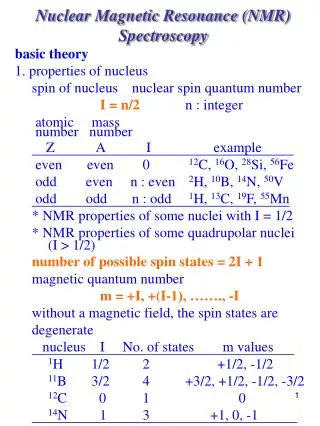
1H Magnetic Resonance Spectroscopy (MRS) • Introduction • commonly detectable metabolites • commonly used 1H MRS data acquisition methods • examples of 1H MRS applications in studies of neurodisorders and breast cancer
Introduction • useful and important as an additional evaluation tool for various neurodisorders, such as brain cancer, stroke, epilepsy, Alzheimer’s disease, multiple sclerosis, etc. • Neuro 1H MRS scans reimbursable. • Research beyond neuro-applications • breast cancer • prostate cancer, etc.
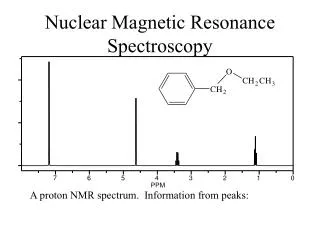
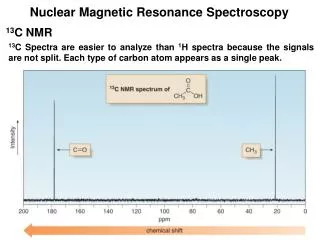
Commonly detectable Brain Metabolites at low field strength ( 1.5T) • N-acetylaspartate (NAA) • neuronal marker • 2.02 ppm • Total creatine (Cr: creatine and phosphocreatine) • Energy storage molecules in tissue • Stable concentration, as internal reference in MRS studies • 3.03 ppm • Choline compounds (Cho: phosphocholine, glycero- phosphocholine) • cell membrane turnover • precursor of molecules for cellular signal transduction • 3.23 ppm • Lactate (Lac) • anaerobic glycolysis • 1.33 ppm
Myo-inositol (mI) • glial marker • precursor of molecules for cellular signal transduction • 3.56 ppm • Higher filed strength ( 3 T) • improved S/N, spectral resolution • more detectable metabolites, such as Gaba • separating glutamate and glutamine • 13C MRS --- glucose metabolism • 31P MRS --- energy metabolism
Common 1H MRS data acquisition • PRESS (Point RESolved Spectroscopy, 90o-180o-180o) • stronger signal, long TE application • STEAM (STimulated Echo Acquisition Mode, 90o-90o-90o) • weaker signal, short TE application • Water suppression (H2O ~ 50 M, metabolites ~ 1-10 mM) • CHESS (chemical shift selective) pulses for saturation • Single voxel • Multi-voxel (CSI, MRSI) • 2D, multi-slice • 3D
90o 90o TE/2 TM TE/2 • STEAM sequence
Single-Voxel MRS Studies of Alzheimer’s Disease(Neurology 2001; 57: 626-632)
1H MRSI Study inMultiple Sclerosis (TE/TR: 135/1500 ms)
Common 1H MRS data quantitation • Metabolite ratio (ratio of peak areas): NAA/Cr, Cho/Cr • Absolute quantitation: mmol/tissue volume • Internal reference: Cr, H2O • Phantom replacement method --- correction for coil load • External reference --- correction for B1 inhomogeneity * MRS signals are both T1 and T2-weighted, corrections for differences in T1 and T2 between in vivo tissue and aqueous solution environments.
Single-Voxel MRS Studies of Alzheimer’s Disease(Neurology 2001; 57: 626-632)
Single-Voxel MRS Studies of Down Syndrome( Am J Psychiatry 1999; 156: 1879-1886)
Single-Voxel MRS Studies of Ts65Dn Mouse---Down Syndrome Model (NeuroReport 2000; 11: 445-448)
Single-Voxel MRS Studies of Ts65Dn Mouse---Down Syndrome Model Li • mI mI-1- phosphate
1H MRSI Study inMultiple Sclerosis (TE/TR: 135/1500 ms)
Significant correlations between NAA/Cho, NAA/Cr, CCSF volume fraction (of the total brain and CSF volume), and BRB scores
Relation between overall neuropsychological performance and standardized predicted score from a multiple regression model including: central cerebral atrophy, lesion volume, and RPPV NAA/Cho (R = - 0.785 p < .001)
NAA quantification using CSF water as internal reference • Reference MRSI scan without water suppression, 1 scan average, other parameters kept the same • Water signal from CSF voxel as internal reference • NAA/H2Oratio corrected for CSF volume fraction in the MRS voxel.
1H MRS Study of Breast Cancer • High false positive rate (60-80%) in conventional mammography, resulting unnecessary biopsy. • Recently, dynamic contrast enhancement (DCE) T1-weighted MRI ---- an integral part of a standard breast cancer diagnostic protocol. • Excellent sensitivity (88-100%) • Specificity rather variable (37-97%)
1H MRS Study of Breast Cancer • Promising tools for improving specificity in detection of breast malignancy: • 1H MRS • Perfusion T2*-weighted MRI • 1H MRS measurement • detection of enhancing Cho signal, marker of active tumor
1H MRS Study of Breast Cancer Single-voxel MRS, PRESS (TE/TR 135/2000 ms)
1H MRS Study of Breast Cancer • DCE MRI: • 100% sensitivity, no false negative • 9 out of 39 positive turned out benign by biopsy ------ 77% specificity. • DCE MRI + MRS: • no false negative • 3 out of 26 MRS cases turned out false positive ------ 88% specificity
1H MRS Study of Brain Cancer • In recent years, in addition to conventional pre- and post-contrast MRI, several other MR techniques have been used for the diagnosis and evaluation of brain tumors. • 1H MRS: diagnosis, clinical evaluation of tumor response to therapy, differentiate tumor recurrence and radiation necrosis. • Elevated Cho signal is a marker of viable tumor • Diffusion Weighted Imaging (DWI): differentiate necrosis, edema, and viable tumor regions. • Perfusion Imaging: evaluate tumor vascularity, assess tumor grade.
Post-contrast T1 Images and Proton Spectra of a Patient with CNS Lymphoma Pre - ICC Post - 1st ICC Post - 4th ICC
ADC and rCBV Maps of a Patient with CNS Lymphoma Pre - ICC Post - 1st ICC Post - 4th ICC
1H MRS for Monitoring Head and Neck Cancer Response to Therapy Localization of Spectroscopic Voxel for a Patient with Metastatic Squamous Cell Carcinoma Pre-therapy Post-therapy
Proton Spectra of a Patient with Metastatic Squamous Cell Carcinoma Pre-therapy Post-therapy
Localization of Spectroscopic Voxel for a Patient with Squamous Cell Carcinoma Pre-therapy Post-therapy
Proton Spectra of a Patient with Squamous Cell Carcinoma Pre-therapy Post-therapy
Discriminating Neoplastic and Non-neoplastic Thyroid Lesions Using 1H MRS • 29 patients with thyroid lesion • 1H MRS examination • PRESS single-voxel (TE/TR 135/2000) • at lesion (n = 29) and at normal contralateral side (n=5) • from healthy control (n=2) • Resection of thyroid mass within one week
Proton spectra from neoplastic thyroid lesion and normal-appearing contralateral region
Non-neoplastic thyroid lesion Normal healthy control Lip/Lac Cho
Significant difference in Cho/Water ratio between neoplastic (3.36 2.55, n=22) and non-neoplastic (0.16 0.11, n=7) thyroid lesions
Results • Thyroid neoplasm Cho/water > 1.0 x 10⁻³ • Thyroid non-neoplasm Cho/water < 0.4 x 10⁻³
Conclusion • Strong correlation between MRS and pathology results • It’s difficult to distinguish neoplastic from non-neoplastic thyroid lesions based on conventional post-contrast T1-weighted images, as both are usually enhanced. • 1H MRS can be a valuable screening tool with high sensitivity in detection of thyroid neoplasm. • Aid in treatment planning and evaluation of post-operation recurrence and node/metastasis.
1H MRS Study of a child with NKH(Non Ketotic Hyperglycinemia)(J Neuroimaging 2001; 11: 209-212)
1H MRS Study of a child with ADEM(Acute Disseminated Encephalomyelitis)
Brain Metabolite Ratios in a Child with ADEM MRS Study NAA/Cr Cho/Cr Lac/Cr Voxel BG initial 0.71 0.76 0.51 BG follow-up 0.83 0.88 0.21 WM initial 1.62 0.91 0.00 WM follow-up 1.38 1.10 0.00
In vivo1H MRS study of a rat model of autism(Physiol Behav 2002; 75: 403-410)