Chapter 17 Atmosphere
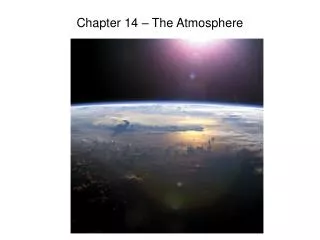
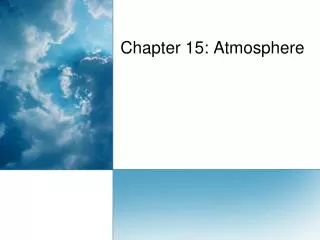
Chapter 17 Atmosphere. Page 365 What does the photograph show? How does the quality of the air in the photograph compare to that of your community today? How might the photograph be different if it was taken on the following day? What makes up the atmosphere?


Chapter 17 Atmosphere
E N D
Presentation Transcript
Chapter 17 Atmosphere • Page 365 • What does the photograph show? • How does the quality of the air in the photograph compare to that of your community today? • How might the photograph be different if it was taken on the following day? • What makes up the atmosphere? • How do human activities affect the atmosphere?
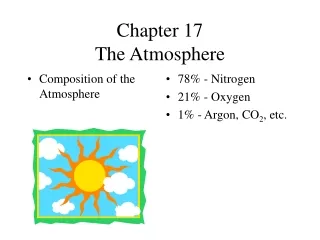
The atmosphere in Balance • The early atmosphere of the earth was primarily created through volcanic eruptions. • Consisted mostly of CO2, SO2, H2O, and Nitrogen • Oxygen was thought to have been created in the upper atmosphere by the destruction of water molecules through Photosynthesis • Today’s atmosphere (99%) is mostly nitrogen and oxygen
Recycling of Atmospheric materials • Composition of the atmosphere changes very little because it is an efficient recycling system • P. 367 Picture explains the O2, CO2, and H2O cycles
A Delicate Balance • The atmosphere may become unbalance by both natural and human origins • e.g. CO2 levels in Hawaii have rose 16% between 1959 and 1999
Environmental Consultant Median annual earnings of environmental scientists were $51,080 in May 2004. The middle 50 percent earned between $39,100 and $67,360. The lowest 10 percent earned less than $31,610, and the highest 10 percent earned more than $85,940. Median annual earnings of hydrologists were $61,510 in May 2004, with the middle 50 percent earning between $47,080 and $77,910, the lowest 10 percent earning less than $38,580, and the highest 10 percent earning more than $94,460. Median annual earnings in the industries employing the largest number of environmental scientists in May 2004 were as follows: Federal Government$73,530Management, scientific, and technical consulting services51,190Architectural, engineering, and related services49,160Local government48,870State government 46,850
Chapter 17.2 • Page 696 • Convert 70°F Celsius • When is the Fahrenheit Scale used? • The Celsius Scale? • Which do you prefer?
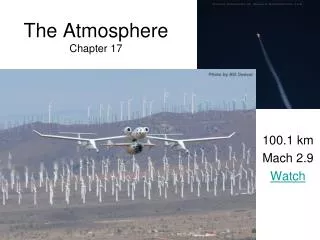
Heat and the Atmosphere • Energy from the sun drives the atmosphere
How Heat Moves • Radiation – transfer of energy through space in the form of visible light • does not require a medium – pass through a vacuum • Conduction – transfer of heat energy by touch • e.g. air bough warm ground becomes warmer • Convection – Transfer of heat energy in a liquid or gas caused by differences in density • e.g. warm air heated by the surface of earth becomes less dense and rises
Heat and Temperature • Temperature – is the measure of the average K.E. of the atoms in the substance • Heat is the total KE of all the particles in a substance • e.g. A tablespoon of water at 100 Celsius has less heat than a cup of water at 100 Celsius • Thermometer is used to measure temperature • At sea level water freezes at 0 Celsius and Boils at 100° Celsius
Structure of the Atmosphere • is divided into 4 layers based on temperature p. 371
Troposphere – lowest layer of the atmosphere where all weather occurs • Temperature decreases with height
Stratosphere – clear dry layer above the Troposphere • Contains the Ozone(O3) Which absorbs UV radiation • Temperature increases with increased height
Mesosphere - the 3rd layer • Temperature decreases with height
Thermosphere – 4th layer • very thin and separated by layers of different gasses • due to the intense solar radiation temperature increases with height • contain the ionosphere • Auroras are formed when electrically charged particles are attracted to the earth’s poles
Insulation and the Atmosphere • Incoming solar radiation is called insulation • Earth receives only two-billionths of the suns rays • Of 100 units (p. 373) of suns energy 30 reflected back into space, 19 Absorbed by the atmosphere, 51 absorbed by Earth’s surface • Unequal insulation caused temperature differences
Discussion – Global Heat Budget • Page 373 • Explain why most of the atmosphere’s heat energy comes indirectly from the sun.
Chapter 17.3 • Which surface is likely to be hotter on a sunny day: • A parking lot blacktop • One with crushed white gravel
Local Temperature Variations • Caused by insulation (energy) heats Earth’s surface and atmosphere unequally
Intensity of Insulation • The angle at which the suns rays strike the earth, the more overhead (90) the more energy • Time of day - Suns rays are closest to vertical at noon. However, the highest temperature occur later in the day because of time needed for the surface to create heat using the insulation • Latitude and equator 90 more insulation where as high latitude sun rays strike at more of an angle less insulation
Time of year – mid latitude locations have higher temperatures in summer because the rays are more direct than in winter • Year’s maximum insulation occurs in June but max temperate are in July, weakest sunlight in December but lowest temps are in January • Cloud Cover – more insulation on clear days because clouds reflect sunlight. However, they hold the heat in at night.
Heating of Water and Land • Water and land warm up and cool off at different rates. Water warms more slowly than land and cools more slowly. • Suns energy penetrates water deeper spreading it out • Some energy is used in evaporation • Water has a higher specific heat • Different hard surfaces absorb radiation differently • light colored surfaces absorbs less than dark • e.g. blacktop gets warmer than grass
Temperature Maps (p. 377) • Land heats and cools off faster than water therefore continents are warmer than nearby oceans in summer and cooler than nearby oceans in winter • Isotherm lines on a map connect places of equal temperatures
Common Air Pollutants • Air Pollution – any airborne gas or particle that occurs at a concentration capable of harming humans or the environment • Clean air act 1970 Identifies 6 key pollutants – CO, NO2, SO2 Pb, O3 and particulates
Acid Rain – Forms when sulfur dioxide and nitrogen oxides react with water vapor in the air. Then falls out with rain and snow • Life forms are sensitive to pH • pH scale 0-14 each increase is 10x the prior • Increased Acid has killed off lakes in Canada and in upper New York • Can also damage limestone structures
Smog - Photochemical Smog - brown haze that forms in air pollution with nitrogen oxides and hydro carbons that come mainly from cars • Creates ground level zones – irritant to lungs and stunts plant growth and yields • Temperature inversion – air at surface is colder than the air above trapping pollutants close to the ground
Ozone Depletion • Thought to be caused by Chlorofluorocarbons. CFC’S are used in aerosols, air conditioners, and solvents that are banned in the U.S. • Ozone absorbs UV form the sun that cause skin cancer in humans
Global Warming • Green house gases such as CO2 trap heat at the earth’s surface • Gasses could be increased form the burning of fossil fuels and global deforestation. • Possible effects • Rising seal levels • Increasing frequency and severity of storms • More frequent heat waves and droughts • Relocation of major crop-growing areas