Χ 2 (Chi-square) Test
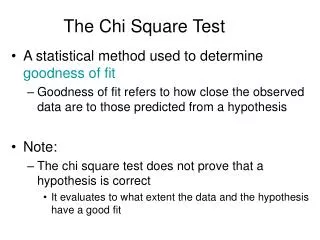
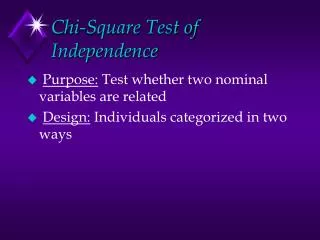
Chapter 13 – How Populations Evolve. Χ 2 (Chi-square) Test. What is a χ 2 (Chi-square) test used for?. Statistical test used to compare observed data with expected data according to a hypothesis. What does that mean?. Let’s look at the next slide to find out….

Χ 2 (Chi-square) Test
E N D
Presentation Transcript
Chapter 13 – How Populations Evolve Χ2 (Chi-square) Test What is a χ2 (Chi-square) test used for? Statistical test used to compare observed data with expected data according to a hypothesis. What does that mean? Let’s look at the next slide to find out…
Chapter 13 – How Populations Evolve Χ2 (Chi-square) Test Ex. Say you have a coin and you want to determine if it is fair (50/50 chance of gets heads/tails). You decide to flip the coin 100 times. If the coin is fair what do you expect/predict to observe? 50 heads and 50 tails Now come up with a hypothesis (two possibilities)
Chapter 13 – How Populations Evolve Χ2 (Chi-square) Test Hypotheses 1. The coin is fair and there will be no real difference between what we will observe and what we expect. 2. The coin is not fair and the observed results will be significantly different from the expected results. The first hypothesis that states no difference between the observed and expected has a special name… NULL HYPOTHESIS
Chapter 13 – How Populations Evolve Χ2 (Chi-square) Test NULL HYPOTHESIS This is the hypothesis that states there will be no difference between the observed and the expected data or that there is no difference between the two groups you are observing. Ex. You wonder if world class musicians have quicker reaction times than world class athletes. What would the null hypothesis be? That there is no difference between these two groups. Let’s get back to flipping coins…
Chapter 13 – How Populations Evolve Χ2 (Chi-square) Test You flip the coin 100 times and you getting the following results: Expected 50 50 Is the coin fair or not? It’s not easy to say. It looks like it might, but maybe not… This is where statistics, in particular the χ2test, comes in.
Chapter 13 – How Populations Evolve Χ2 (Chi-square) Test The formula for calculating χ2 is: Where O is the observed value and E is the expected. What happens to the value of χ2 as your observed data gets closer to the expected? Χ2 approaches 0 Let’s determine χ2 for the coin flipping study…
Chapter 13 – How Populations Evolve Χ2 (Chi-square) Test Expected 50 50 Χ2 = (41-50)2/50 + (59-50)2/50 Χ2 = (-9)2/50 + (9)2/50 Χ2 = 81/50 + 81/50 Χ2 = 3.24 So what does this number mean…?
Chapter 13 – How Populations Evolve Χ2 (Chi-square) Test Converting Χ2 to a P(probability)-value Statisticians have devised a table to do this: Great, but how do you use this?
Chapter 13 – How Populations Evolve Χ2 (Chi-square) Test Converting Χ2 to a P(probability)-value First we need to determine Degrees of Freedom (DoF): DoF = # of groups minus 1 We have two groups, heads group and tails group. Therefore our DoF = 1.
Chapter 13 – How Populations Evolve Χ2 (Chi-square) Test Converting Χ2 to a P(probability)-value Then scan across and find your X2 value (3.24) Lastly go up and estimate the p-value… P-value = ~0.07 What does this value tell us?
Chapter 13 – How Populations Evolve Χ2 (Chi-square) Test The P-value P-value = ~0.07 The p-value tells us the probability that the NULL hypothesis (observed and expected not different) is correct.
Chapter 13 – How Populations Evolve Χ2 (Chi-square) Test Expected 50 50 P-value = ~0.07 Therefore, there is a 7% chance that the null hypothesis (there is no real difference between observed and expected) is correct.
Chapter 13 – How Populations Evolve Χ2 (Chi-square) Test Expected 50 50 P-value = ~0.07 You might say then that the other hypothesis must be correct as there is a 93% likelihood that there is a different between observed and expected…
Chapter 13 – How Populations Evolve Χ2 (Chi-square) Test 50 50 P-value = ~0.07 However, statisticians have a p-value = 0.05 cutoff. In order for the hypothesis to be supported, p must be less than 0.05 (5% chance that null is correct). Therefore the null hypothesis cannot be rejected.
Chapter 13 – How Populations Evolve Χ2 (Chi-square) Test For example, suppose that a cross between two pea plants yields a population of 880 plants, 639 with green seeds and 241 with yellow seeds. You are asked to propose the genotypes of the parents. Your hypothesis is that the allele for green is dominant to the allele for yellow and that the parent plants were both heterozygous for this trait. If your hypothesis is true, then the predicted ratio of offspring from this cross would be 3:1 (based on Mendel's laws) as predicted from the results of the Punnett square. Is it?
Chapter 13 – How Populations Evolve Χ2 (Chi-square) Test
Chapter 13 – How Populations Evolve Χ2 (Chi-square) Test
Chapter 13 – How Populations Evolve Χ2 (Chi-square) Test
Chapter 13 – How Populations Evolve Χ2 (Chi-square) Test
Chapter 13 – How Populations Evolve Χ2 (Chi-square) Test