Download
1 / 34
340 likes | 469 Vues
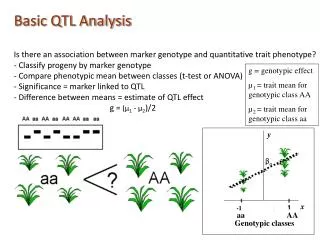
Power Calculation for QTL Association. Pak Sham, Shaun Purcell Twin Workshop 2001. Biometrical model. Genotype AA Aa aa Frequency (1-p) 2 2p(1-p) p 2 Trait mean -a d a Trait variance 2 2 2 Overall mean a(2p-1)+2dp(1-p). P ( X ) = G P ( X | G ) P ( G ).

E N D
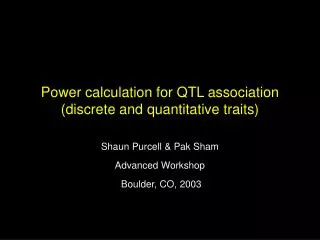
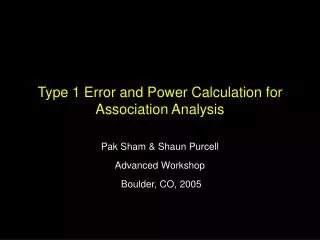
Power Calculation for QTL Association Pak Sham, Shaun Purcell Twin Workshop 2001
Biometrical model • Genotype AA Aa aa • Frequency (1-p) 2 2p(1-p) p2 • Trait mean -a d a • Trait variance 2 2 2 • Overall mean a(2p-1)+2dp(1-p)
P(X) = GP(X|G)P(G) P(X) Aa AA aa X
aa Aa AA Linear regression analysis
Power of QTL association - regression analysis • N = [z - z1-] 2 / A2 • z : standard normal deviate for significance • z1- : standard normal deviate for power 1- • A2 : proportion of variance due to additive QTL
Required Sample Sizes QTL variance 10%
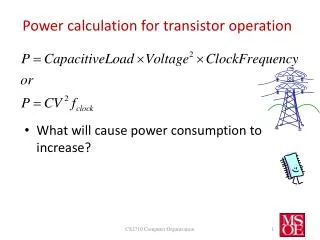
Power of likelihood ratio tests • For chi-squared tests on large samples, power is determined by non-centrality parameter () and degrees of freedom (df) • = E(2lnL1 - 2lnL0) • = E(2lnL1 ) - E(2lnL0) • where expectations are taken at asymptotic values of maximum likelihood estimates (MLE) under an assumed true model
Variance/Covariance explained • The better the fit of a means model: • - the greater the explained variances and covariances • - the smaller the residual variances and covariances
Definitions of LD parameters • B1 B2 • A1 pr + D ps - D p • A2 qr - D qs + D q • r s • pr + D < min(p, r) • D < min(p, r) - pr DMAX = min(ps, rq) • = min(p-pr, r-pr) D’ = D / DMAX • = min(ps, rq) R2 = D2 / pqrs
Exercise: Genetic Power Calculator • Use Genetic Power Calculator, Association Analysis option • Investigate the sample size requirement for the between and within sibship tests under a range of assumptions • Vary • sibship size • additive QTL variance • sibling correlation • QTL allele frequencies • marker allele frequencies • D’
N for 90% power • Individuals • 0 - 10% QTL variance • QTL, Marker allele freqs = 0.50 • D-prime = 1 • No dominance • Type I error rate = 0.05 • Test for total association
Effect of sibship size • Sibship size 1 - 5 • Sib correlation = 0.25 , 0.75 • 5% QTL variance • QTL, Marker allele freqs = 0.50 • D-prime = 1 • No dominance • Type I error rate = 0.05
Exercises • 1. What effect does the QTL allele frequency have on power if the test is at the QTL ? • 2. What effect does D’ have? • 3. What is the effect of differences between QTL and marker allele frequency?
Allele frequency & LD • QTL allele freq = 0.05, no dominance • Sample sizes for 90% power : • Marker allele freq 0.1 0.25 0.5 • D’ 1 1 1 • N 205 625 1886 • Marker allele freq 0.1 0.25 0.5 • D’ 0.5 0.5 0.5 • N 835 2517 7560