Download
1 / 17
200 likes | 362 Vues
Use of the Basin Development Factor to Urban Watershed Response. Theodore G. Cleveland Shiva Sunder David Thompson. Acknowledgements. W.H. Asquith, M.S. Roussel , USGS-Austin; S. Fitzgerald, HCFCD; D. Barrett, F. Liscum , D. Schwartz, S. Johnson ( RGMiller , PBS&J, NWS, LJA)

E N D
Use of the Basin Development Factor to Urban Watershed Response Theodore G. Cleveland Shiva Sunder David Thompson
Acknowledgements • W.H. Asquith, M.S. Roussel, USGS-Austin; S. Fitzgerald, HCFCD; D. Barrett, F. Liscum, D. Schwartz, S. Johnson (RGMiller, PBS&J, NWS, LJA) • Texas Department of Transportation, Harris County Flood Control District.
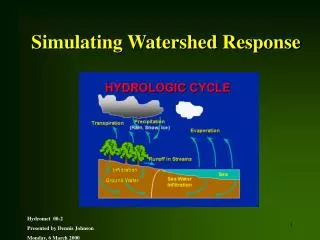
Background • Needed to explain hydrologic responses to answer: • How have responses changed with urbanization over time (in a coastal low-slope area)? • How will responses change as urbanization proceeds? • Want to use the answers to understand how to implement drainage policy, etc.
Background • Assumptions: • Response of a watershed is controlled in large part by its topography, storage properties, and loss (or runoff generation) properties. • Observe that topography is relatively unchanged in urban watersheds (we are not moving mountains in our study area) but hydrologic response certainly changes. • Response change is some proportion to changes in storage, runoff generation, and conveyance efficiency to the outlet.
Background • Prior Work: • Various work in Houston and in broader Texas area demonstrated that a large fraction of variability is explained by topography, but a distinction between undeveloped and developed was used (binary distinction). • A basin-development-factor extends the classification by more categories, possible that such further refinement could improve estimates.
Background • Basin DevelopmentFactor (BDF) • The BDF (Sauer et al., 1983)is a metric thought to be associated with runoff transport efficiency of the drainage systems in a watershed. • The BDF indirectly addresses the storage and transport components of a watershed’s runoff signal. • BDF is a categorical variable, whose value is assigned based on the prevalence of certain drainage conditions that result from urbanization of a watershed.
Basin Development Factor • Basin DevelopmentFactor (BDF) • Scoring based upon presence of • (1) Channel Improvements: straightening, deepening, clearing and enlarging. • (2) Channel linings • (3) Storm drains or storm sewers: • (4) Curbs and gutters: • Value from 0-12. Most analysts produce same scores (+/- 1) when using the same imagery.
What We Did • Determined present-day BDF for 133 watersheds in Texas with paired rainfall-runoff observations. (historical BDF for a subset was also available) • Prior analysis of the rainfall-runoff data produced peak discharge factors (Qp), and characteristic times (Tp) – these values were segregated by BDF to examine if a useful relationship exists. • Conjecture: • BDF -> small, Qp -> small, Tp -> large. • BDF -> large, Qp -> large, Tp ->small.
Study Area • 130+ Texas watersheds. • 3000+ storms.
What We Learned • Considerable variability • Evidence in the plot supporting the conjecture. • More than binary distinction, but not huge demarcations. Decreasing BDF Increasing BDF
What We Learned • Model and observed responses. • Black= storm optimized. • Blue = terrain model (binary considerations of development) • Red = BDF result. • Increased variability.
What We Learned • Inclusion of BDF as an explanatory variable did not increase prediction performance as compared to binary classification of developed/undeveloped. • If zero-discharge cases are censored (not shown), there is support of the conjecture that BDF explains a portion of response.
Recent Efforts • Added ARS paired datasets from 30+ watersheds around the USA; re-analyzed entire database. • Have 4 “groups”: • ARS Not-Texas • Small Rural – Texas • Urban – Texas (not Houston) • Houston.
Study Area • 130+ Texas watersheds. • ARS Research Watersheds from: • Arkansas • Georgia • Indiana • Iowa • Nebraska • Ohio • Virginia
Small Rural-Texas Decreasing Slope Developed, Not Houston - Texas ARS – Non-Texas Increasing BDF Houston-Texas ACRES
Summary • BDF applied as part of broader study of response metrics. Exhibits some utility when zero-discharge cases are censored. • BDF increase correlated with characteristic time decrease (anticipated result). • Slope (as an explanatory variable) plays a confounding role.
Where we are heading • Continued to explore the concept --- seems to have value within a geographic region. • BDF 0-3 is associated with larger characteristic time, BDF 9-12 is associated with smaller characteristic time. • In the intermediate range of the categorical variable, there is ambiguity.