The Development Gap – The essentials
This document explores the development gap between MEDCs (More Economically Developed Countries) and LEDCs (Less Economically Developed Countries), emphasizing essential development measurements and indicators such as GNP per capita, HDI (Human Development Index), and life expectancy. It discusses the limitations of using single indicators and the importance of multi-dimensional approaches to assess quality of life and standard of living. Additionally, it reviews the complexities of classifying countries and factors that exacerbate global inequalities, including economic, environmental, and social issues.
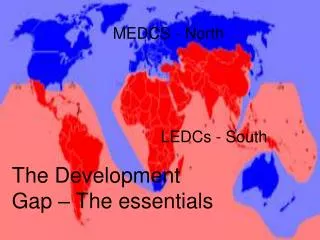

The Development Gap – The essentials
E N D
Presentation Transcript
MEDCS - North LEDCs - South The Development Gap – The essentials
Development measurements/indicators GNP per capita (per person/head) - This is the total amount of money that a person makes in a country, usually given in US dollars. GNP - Total amount of money that a country makes ($US) HDI (Human Development Index) - It divides the world into 3 groups of countries: Low (lowest indices), medium and high (highest indices). It is worked out by a formula using measures of life expectancy, literacy, educational attainment and GDP per capita for each country. It uses a scale from 0 to 1 (maximum). Birth/death rates - Number of births or deaths / 1000 people in a country / year. Literacy rate - % of people who can read and write. Life Expectancy - This is the average number of years a person can expect to live Infant mortality - These are the amount of children out of every 1000 born alive that die before the age of 5. Healthcare - You can measure the amount of doctors per 1000 of the population in a country and the number of hospitals in a country
Scattergraphs – how used with development indicators? Scattergraphs are used to compare 2 sets of data e.g. % of people employed in agriculture and GNP per head, on other words to see if there is a correlation. If one set of data increases and so does the other, then there is a positive correlation. If one set of data increases but the other set decreases, then this is a negative correlation. The 'line of best fit' goes roughly through the middle of all the scatter points on a graph.
Limitations of using a single indicator e.g. GNP/capita • The figures can be misleading on their own, as they are averages e.g. GNP per capita may be very high as a result of some very rich people living in a country, whereas a lot of the population may actually be quite poor e.g. Iran • They do not show variations across a country e.g. in Devon, GNP per capita is much lower than London • As a country develops, some aspects develop before others e.g. in Ecuador, literacy rates are high but GNP per capita is very low • HDI may be better to use as it measures 3 variables: life expectancy. Levels of education, literacy and GDP per capita (income) • What do we mean by Quality of Life and Standard of Living?They are not the same! • Standard of living refers to the economic level (wealth) of a person’s daily life. Are they comfortably off or not? It can be measured. • Quality of life is how good or bad people think their life is (perception). This cannot be measured e.g. people may be poor but educated, have a long life expectancy and are health. In this situation, standard of living is low but quality of life is good.
How can we classify the world? Who is rich and who is poor? In 1971, The Brandt Report used GNP per capita (wealth) to make a simple division between the rich (industrialised) and poor (mainly agriculturally based) countries of the world. A line called the North-South divide was drawn on a world map to make this difference clear. Recently, this approach has become less popular as it is seen to be too simple.
Why is this simple division no longer valid? • Development is not only economic (wealth/jobs) but also social (education/healthcare/life expectancy etc.) and cultural • Some LEDCs are growing more rapidly than most MEDCs. A new category had to be introduced to cover those developing fastest. They became known as NICs (newly industrialising countries e.g. China) • Even within a country, there can be significant differences between people and regions • It does not cover variations in quality of life • Some countries grow richer at a greater rate than others and some may get • poorer so a simple two-fold division is no longer acceptable • A five-fold division is more realistic because it recognises the great variety in the • types of country (1. rich industrialising e.g. USA 2. oil exporting e.g. Saudi Arabia • 3. newly industrialising e.g. China 4. former Communist e.g. Russia 5. Heavily in • debt e.g. many African countries)
What factors make global development inequalities worse? • PHYSICAL/ENVIRONMENTAL FACTORS (natural) • Countries near the tropics suffer from more climate related diseases than cooler parts of the world e.g. malaria. People cannot work as they are so ill. • Environmental hazards (natural events which threaten peoples’ lives and property, particularly climatic hazards e.g. drought/flooding are a problem in countries like Ethiopia and Mozambique). These limit development e.g. agriculture. • ECONOMIC FACTORS (costs) • Civil war has made many countries poor e.g. Somalia, Sierra Leone and Ethiopia etc. • Global trade policies have not favoured the poorest countries. Sometimes tariffs (govt. tax on imported/exported goods) are put on goods by the buying country, discouraging the buying of these goods. • World trade is often unfair. There are many disadvantages for LEDCs and a few advantages for MEDCS with world trade:
LEDCs sell mainly primary products which are of low value (more supply than demand) and make little money for that country. • MEDCs can buy raw materials/primary products from alternative sources (other LEDCs) • Farmers are often poor in LEDCs (as a result of low prices), so do not earn enough to support their families • The prices of raw materials e.g. fruit, coal etc. have not risen as much as manufactured goods (made in MEDCs) • A lot of LEDCs depend on exporting one raw material e.g. Cocoa, Ghana = 80%. If the world price collapses or the harvest is bad, they receive less money, leading to job losses etc. • LEDCs have little industry (factories), so have to buy expensive, manufactured goods e.g. TVs from MEDCs • 7. LEDCs suffer a trade deficit (money spent on imports > exports) • Advantages for MEDCs: • They have a ready supply of raw materials • They can control the processing of goods (have factories) and create more jobs • They can have more political power in controlling trade (choose who to buy from)
SOCIAL FACTORS (people’s health, lifestyle, community) • Water quality – poor water quality causes disease, which makes people ill/unable to work and prevents economic development. In many LEDCs, diseases are carried in water and water quality is unreliable. • Reliability of water supply – inadequate water supplies limits crop yields (harvests) and therefore food supply. If in short supply, people waste a lot of time searching and then carrying it. • Education – LEDCS find it difficult to fund education for all children i.e. investors are put off by a lack of an educated workforce • Health – for LEDCS with a poor health system, there will be many people who are sick and incapable of working. • POLITICAL FACTORS (government decisions) • Corrupt politicians make themselves richer illegally at the expense of their country’s development, often by using this money to keep them in power e.g. Zimbabwe. Here, land was taken from white farmers by government officials. The country’s economy has been destroyed. • When this happens, money is not spent on education, health services, roads, clean water and sanitation • Corrupt governments are unstable. Foreign investors are discouraged from investing money because they cannot guarantee that money will reach its target.
CASE STUDY to show the impact of a natural hazard on a country’s development – Japan 2011 • Many people were injured or killed (est. 25,000 dead) • Many people’s homes were destroyed (1/2 million homeless) • Government estimates that it will cost $309 billion to rebuild homes, farms, factories, roads, railways and electricity lines • As many factories destroyed, difficult to export goods i.e. generate income • Difficulties in producing enough electricity, as nuclear power stations damaged i.e. affecting businesses
How can international efforts reduce global inequalities? • OVERVIEW • Loans are sums of money that at some time in the future have to be paid back • with interest. This helped some countries develop but others have struggled paying back loans in the world recession. A country which wants funds for development projects can: • Borrow from other countries • Borrow from world financial organisations (e.g. IMF, World Bank) or international banks e.g. HSBC • If the project is a success, the debt is repaid. However, if the debt cannot be paid back, this then has to be paid back over a longer period and the standard of living and level of development cannot improve. • Aid is gifts of money, goods, food, machinery, technology and trained workers. The aim is to raise standards of living. • Why is it needed? • To help after disasters e.g. 2004 SE Asia Tsunami; help with large development schemes e.g. airports, building dams etc; to improve basic services and amenities e.g. reliable water supply, hospitals, schools etc. • True aid is not a loan that needs to be repaid. However, in the real world, some ‘aid’ has payback connected to it.
How can international efforts reduce global inequalities? • How can LEDCs be helped? • DEBT RELIEF • This is where the amount of interest or the loan is reduced. Sometimes debts are written off. Debtor countries (those who have borrowed) benefit hugely as they can start to improve the quality of life of their citizens. • LOAN SOLUTIONS • Small businesses in the USA have been lending money to individuals in LEDCs. It enables people to invest in equipment, hire extra workers (if necessary) and raise output. The technology used was appropriate, allowing the business to become sustainable and successful. • CONSERVATION SWAPS • These are agreements whereby a proportion of a country’s debts are written off in exchange for a promise by the debtor country to carry out environmental conservation projects e.g. tropical rainforest.
FAIR TRADE • Fair trade is an international movement ensuring that producers in LEDCs get a fair deal. They receive a minimum guaranteed price for their crop which helps them maintain a reasonable standard of living • TRADING GROUPS • This is where members (countries) get and work together e.g. Mercosur: Mercosur is the trade group in South America. It has 4 full members (Argentina, Brazil, Paraguay and Uruguay). As a result: • They will more likely control the price of the goods they export. • It will make it more difficult for richer countries to shop around to find a • cheaper price. • Tariffs between countries can be scrapped making it easier to trade • AID • There are different types of aid: • Short term aid e.g. food, clothing and medicines intended to help people who are suffering from a disaster such as an earthquake, a flood, a famine or war. • Long term (after 1 month) aid is loans to governments to help them with economic development e.g. building schools/hospitals, investment in industry and agriculture
3. Multilateral aid is when MEDCs give money to international organisations e.g. World Bank, International Monetary Fund (IMF) or the United Nations (UN) which then redistribute it to LEDCs for development projects • 4. Bilateral/Tied aidis when aid is given to a poor country on the condition that all or part of the money will be spent on buying commodities from the donor countries. This is done to boost the export incomes of donor countries. The problem with tied aid is that the recipient country is not able to shop around for the best prices or the most appropriate product • 5. Top-down aid is used so governments can run more efficiently or to build infrastructure such as roads and bridges • 6. Bottom-up aid is used to provide basic health care for communities, clean drinking water and money for education • What are the advantages of aid? • It helps people through a crisis/ saves lives • New industries improve skills and employment • Better farming (new and better crops) • New infrastructure such as schools and hospitals are built
What are the disadvantages of aid? • Big projects e.g. building airports/dams often destroy people’s homes • Lack of money for fuel, spare parts etc. • May not be sufficient funding to maintain schools and hospitals to adequate level • Countries become dependent on aid and fail to progress themselves • How can international aid can encourage sustainable development in a poor country(ies)? • CASE STUDY 1: ACTION AID, CALCUTTA, INDIA • Action Aid works to alleviate poverty. Some of it’s work is done through sponsorship schemes. Donors are encouraged either to: • Give monthly to general projects • Sponsor a child and his/her family or community • This is a successful approach. Low technology is used. Local people benefit (both individuals and communities) and costs are kept low. Environmental quality is improved.
CASE STUDY 2: STUDENT PARTNERSHIP WORLDWIDE (SPW) • SPW is a UK based organisation placing gap year students in development projects in countries like Uganda. They work with pupils and farmers to: • Raise awareness of AIDs through role plays and drama in schools • Teach energy conservation methods e.g. how to make a fuel-efficient stove or how to start a tree nursery (growing trees form seeds) to provide wood for fuel • Introduce appropriate technology e.g. covering natural springs (creating covered water tank) so that water supplies don’t get polluted from animal waste i.e. improving living standards • In villages, primary and secondary schools have had SPW students as volunteer teachers, providing lessons and workshops on sexual health awareness and improving life skills A demonstration on how to keep banana plants disease free
How do levels of development vary within the EU? • CASE STUDY: BULGARIA (POOR)V UK (RICH) • There are marked variations in levels of development in the EU. What factors influence a country’s development? • ENVIRONMENTAL: (Climate, Relief – height and steepness of land; water supplies; frequency of natural hazards; availability of raw materials) • ECONOMIC: (Trading links; amount of debt; type of products which are exported) • SOCIAL: (Availability of clean drinking water; place of women in society; child education) • POLITICAL: (Stability of government; govt. corruption; war)
Case study of a poor country in the EU - Bulgaria Today, it is a democracy (government elected by its citizens), but previously it was a communist country where private businesses/companies were not allowed. Everything was owned by the government (state). Industry was old, inefficient and other European countries could produce goods cheaper, which meant that it was not profitable. A large part of Bulgaria is mountainous (Rhode and Balkan Mountains), with steep slopes and poor thin soils, meaning that agriculture is difficult and some food is imported. It also has few natural resources (bauxite, copper, lead, zinc, coal, timber and arable land) Case study of a rich country in the EU – UK The UK has a climate which is neither too hot nor too cold and there are rarely problems with drought (apart from recent summers). This means that agriculture is able to produce a lot of food to feed the UK population. The UK has ample rainfall to create reservoirs for domestic, industrial and agricultural use. The UK does not have high, steep mountains stopping industrial/agricultural production. UK has plenty of resources i.e. industry/power stations/factories have easily developed, providing jobs and goods for export. Services e.g. tourism, banking, insurance and business services generate much of the UK’s income (industry has declined). Better education leads to a higher paid job which means a person spends more, helping the UK to become richer. The UK government is stable and not corrupt (which means it invests in healthcare, education and improving the economy).
EU Policies to reduce different (unequal) levels of development • There are 4 main ways in which the EU is trying to reduce inequalities: • The Common Agricultural Policy (CAP) • Urban Funds • European Investment Bank (EIB) • Structural Funds
Common Agricultural Policy (CAP) • It’s main purposes are: • Guarantee minimum levels of production, so there is enough food for Europe’s population • Ensure a fair standard of living for farmers • Ensure reasonable prices to customers Under CAP, farmers are subsidised (paid) to grow certain products. Also, when world food prices are low, The EU buys produce and guarantees farmers a reasonable income. CAP also puts a high tax on imported foreign produce, so people in the EU are more likely to buy food produced in the EU (its cheaper!) Urban Fund • This is where money is given to certain EU cities e.g. Teruel, Northern Spain to provide economic (create jobs), social (reduce crime) and environmental regeneration (increase green space e.g. parks). Money is divided according to need (total population and unemployment rates) i.e. Germany gets the most Euros! • In Teruel, they have a new ring road, reducing traffic flows through the town by 20%, cutting congestion and improving travel times and air quality in the town. The new road links previously isolated neighbourhoods and there are paths for cyclists and joggers.
European Investment Bank (EIB) Its money comes from the member countries who own it. Its main purpose is to invest in regional development, where industry/farm incomes have declined. Projects are usually locally based and funds are used to train people with new skills and to help set up new businesses. Structural Funds These support poorer regions of Europe and improve infrastructure, particularly transport links, as these help boost the economy of an area e.g. through tourism and job opportunities. Regions whose GDP per capita is less than 75% of the EU average are targeted – the aim being to get all members to the same level of development.