Download
1 / 16
160 likes | 172 Vues
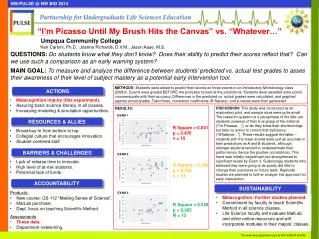
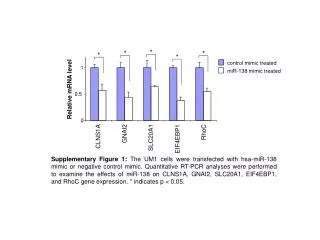
Explore the accountability system for 2018-2019 and analyze student group performance in four components: Academic Achievement, Academic Growth, English Language Proficiency, and Student Success. Compare scores with other campuses with the same Economic Disadvantage percentage. Utilize Domain 1, Domain 2A, and Domain 2B scores to calculate the final score. Consider historical data, benchmarks, and thresholds for better data analysis. Join our Break-Out Session for more insights!

E N D
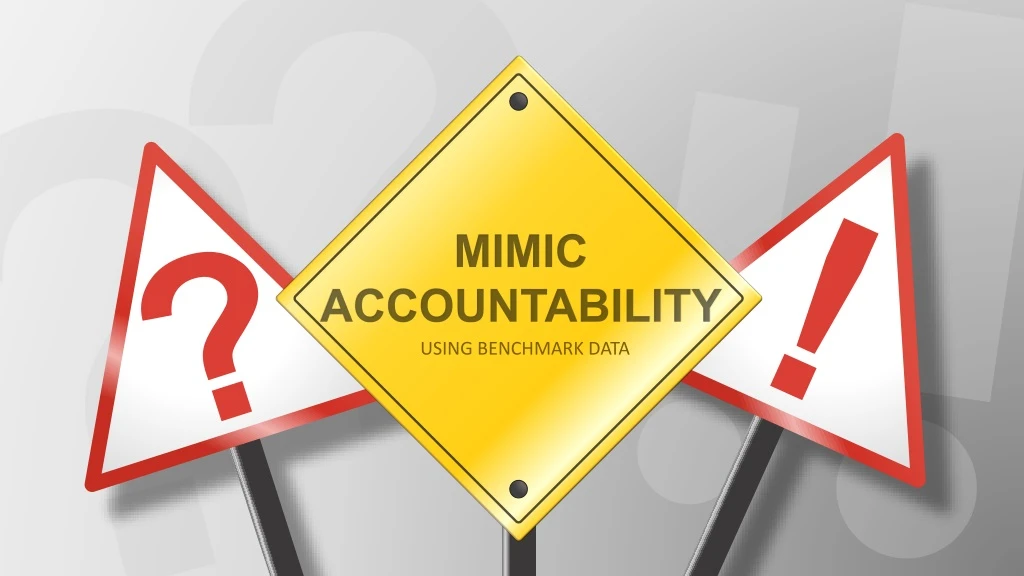
! ? MIMIC ACCOUNTABILITY USING BENCHMARK DATA
The accountability system will be the same as 2018 2019 Domain 3 • How did each student group do in four components? • Academic Achievement - Meets performance in reading and math • Academic Growth - reading and math • English Language Proficiency – TELPAS • Student Success - Average of Approaches, Meets, and Masters (All subjects) D3 Domain 2B Comparing your Domain 1 score with other campuses with the same percentage of Economic Disadvantage. D2B Domain 2A Percent of students scoring at least as high as they did last year in Reading and Math (All Grades) D2A Final Score 70% Best of Domain 1, Domain 2A, and Domain 2B 30% The 4 components of Domain 3 D1 Domain 1 The average of Approaches, Meets, and Masters (All Subjects and Grades)
Up to 14 student groups count for Domain 3 Must have 25 tests Domain 3 Special Ed. & Former Special Ed. Economically Disadvantaged Ethnicity/Race African American, Hispanic, White, American Indian, Asian, Pacific Islander, Two or More English Learners All Students Continuous Enrolled & Non-Cont Enrolled STAAR and STAAR Alt 2 English and Spanish Testers Current and Monitor through year 4 Year 2
30% 33.3% Status of Four Components Up to 14 student groups Must have at least 25 tests Domain 3 Academic Achievement 10% Meets grade level for reading and math. EL Proficiency Based on TELPAS performance scoring at Advanced High or higher than last time. 55.6% 50% Academic Growth 10% 11.1% Reading and Math . Student Success Average of Approaches Meets and Masters (All subjects)
TEA says we will use the same targets for four more years 2019 RAW SCORE TARGETS ARE PROVIDED LOW HIGH F D C B A GREEN RANGE Think about how many more students would it take to get to the next Threshold PROGRESS/GROWTH MEETS AVERAGE
New Quick View Data Analysis & Thresholds ??? Questions Historical Data Benchmarks & Accountability Come to my Break-Out Session today!!