Download
1 / 1
10 likes | 132 Vues
Explore using Multiscale Entropy on audio data for Obstructive Sleep Apnea classification, achieving similar results to the AHI measure. Results show promise for high accuracy in identifying OSA severity. Future work includes combining data sources to enhance the approach.

E N D
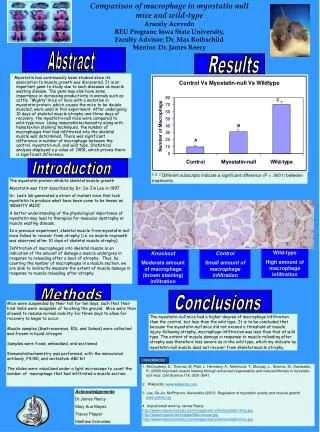
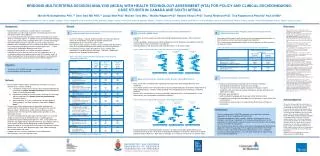
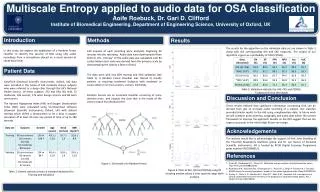
Multiscale Entropy applied to audio data for OSA classificationAoife Roebuck, Dr. Gari D. Clifford Institute of Biomedical Engineering, Department of Engineering Science, University of Oxford, UK Introduction Methods Results The results for the algorithm on the validation data set are shown in Table 2 along with the corresponding AHI and ODI measures. The output of our algorithm is given as a probability of OSA (P(OSA)). In this study, we explore the application of a Random Forest classifier to identify the severity of OSA using only audio recordings from a microphone placed on a nasal cannula at cheek bone level. 240 minutes of each recording were analysed, beginning 30 minutes into the recording. Audio data were downsampled from 4kHz to 1Hz. Entropy1 of the audio data was calculated over 84 scales (where each scale was derived from the previous scale by downsampling the data by a factor of two). The data were split into 66% training and 34% validation (see Table 1). A Random Forest Classifier was trained to classify patients as requiring treatment (subjects with moderate or severe OSA) or not (non-snorers, snorers, mild OSA). Random Forests are an ensemble classifier consisting of many decision trees and outputs the class that is the mode of the classes output by individual trees. Patient Data GreyFlash (Stowood Scientific Instruments, Oxford, UK) data were recorded in the home of 536 randomly chosen subjects who were referred to a sleep clinic through the UK’s National Health Service. Of these subjects, 272 had OSA (64 mild, 72 moderate, 136 severe), 176 were benign snorers and 88 were non-snorers. The Apnoea Hypopnoea Index (AHI) and Oxygen Desaturation Index (ODI) were calculated using Visi-Download software (Stowood Scientific Instruments, Oxford, UK) with default settings which define a desaturation to be a drop in oxygen saturation of at least 4% over any period of time of up to 180 seconds. Table 2: Validation statistics for AHI, ODI and P(OSA). * indicates clinical thresholds Discussion and Conclusion These results indicate that significant information concerning OSA can be derived from just an on-body audio recording of a subject. Our classifier provided similar results to the AHI using complimentary data. In future work we will combine pulse oximetry, actigraphy and audio data within the current framework to improve the approach. Results on the ODI suggest that we can expect accuracies in the mid to high 90 per cent range. Acknowledgements The authors would like to acknowledge the support of Prof. John Stradling of the Churchill Respiratory Medicine group and Dr. Lyn Davies of Stowood Scientific Instruments. AR is funded by RCUK Digital Economy Programme grant number EP/G036861/1. References Figure 1: Schematic of a Random Forest • Costa M., Goldberger A.L., Peng C.K. Multiscale entropy analysis of physiologic time series. Phys Rev Lett 2002:89:062102 • Ruehland W.R., Rochford P.D. O’Donoghue F.J., Pierce R.J., Singh P. Thornton A.T. The new AASM criteria for scoring hypopneas: impact on the apnea hypopnea index Sleep 2009:32:150 • Gyulay S., Olson L.G., Hensley M.J., King M.T., Allen K.M., Saunders N.A. A comparison of clinical assessment and home oximetry in the diagnosis of obstructive sleep apnea. Am J Resp Crit Care 1993:147:50 Figure 2: Plots of AHI, ODI and P(OSA) using RF showing median values ± inter quartile range (with outliers) Table 1: Patient statistics (mean ± standard deviation) for Training and Validation