Download
1 / 15
160 likes | 471 Vues
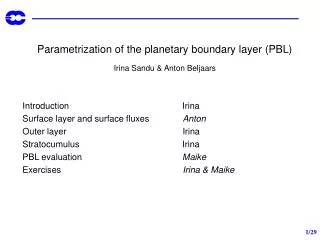
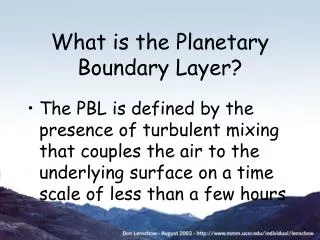
Height of the Planetary Boundary Layer During ICEALOT 2008. Virginia Sawyer Advisors: Ruth Varner, Judd Welton August 5-6, 2009. Free Troposphere. Mixed Layer. Planetary Boundary Layer. The transition between well-mixed surface air and the free atmosphere aloft, typically ~1 km

E N D
Height of the Planetary Boundary Layer During ICEALOT 2008 Virginia Sawyer Advisors: Ruth Varner, Judd Welton August 5-6, 2009
Free Troposphere Mixed Layer Planetary Boundary Layer • The transition between well-mixed surface air and the free atmosphere aloft, typically ~1 km • Usually maintained by a temperature inversion, which is buoyantly stable. • Mixed layer: high aerosol concentrations, nearly uniform with height • Free troposphere: less polluted, more vertical stratification
Aerosols in the Arctic • Solid or liquid particulate in the atmosphere • Affects global climate both before and after removal from the atmosphere • Affects air quality and visibility • Major source of anthropogenic pollution to the Arctic, including trace metals
PBL Transport and the PBL • Aerosol that remains below the PBL settles out within a few kilometers of its origin • Aerosol that reaches the free troposphere can enter long-range transport, and eventually deposit thousands of kilometers away • Areas with few local emission sources are still subject to pollutants that have crossed the PBL
ICEALOT and the Arctic Haze • Arctic air pollution peaks in spring: the Arctic haze • Triggered by polar sunrise, dissipated by precipitation in summer • R/V Knorr 19 March-24 April • NOAA funded project to study atmospheric chemistry for IPY
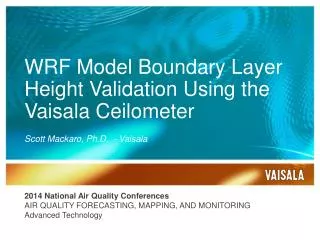
Lidar with MPLNET • 527-nm laser beamed upward from the ground (or the deck of the ship) • Photons deflected by aerosol are detected with return time; yields height of particle • Vertical backscatter profile approximately corresponds to aerosol concentration with height
Other Sources of PBL Data • ICEALOT balloon sondes • Temperature profiles • Up to 4 launches per day • Overpasses by CALIPSO satellite • Aerosol lidar • April 7th, 11th, 19th, and 21st http://www.nasa.gov/mission_pages/calipso/main/
PBL Detection Algorithm Wavelet covariance transform using the Haar function z = altitude a = dilation b = translation
Algorithm sometimes chooses elevated cloud or aerosol signal rather than PBL • 3-km threshold introduced to exclude high features
Comparison to Sonde-Derived PBL Height RMSE 0.497 km
April 11, 2008 – approaching Tromsø, Norway http://mplnet.gsfc.nasa.gov/data.html
Conclusions • Most anthropogenic aerosol in the Arctic depends on PBL behavior for transport, mixing, and removal • Aerosols in the Arctic affect global atmospheric chemistry and climate • Aerosol lidar can detect the PBL height with much better time resolution than direct observation (i.e. sondes), enough to watch changes develop • Future work: CALIPSO, mechanism for mixing through the Arctic marine PBL
Acknowledgments Peter Kelly Ruth Varner Doug Vandemark Judd Welton Dan Wolfe Bob Talbot R/V Knorr and ICEALOT crew AIRMAP MPLNET at NASA-GSFC Research & Discover Committee Members