Download
1 / 1
20 likes | 234 Vues
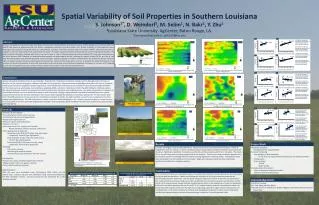
Introduction:. Barrow. Figure 7: Spatial distribution of liquid water path on October 6 and 9. Oliktok Point.

E N D
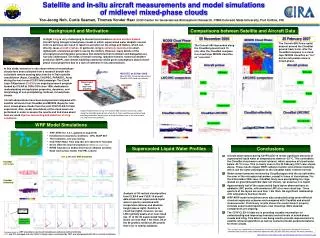
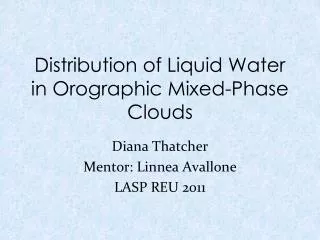
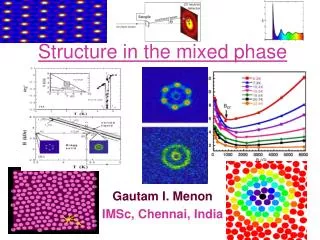
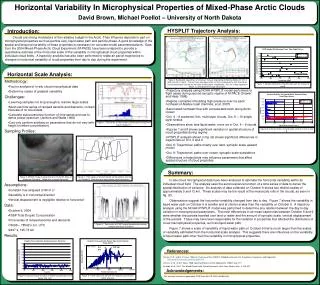
Introduction: Barrow Figure 7: Spatial distribution of liquid water path on October 6 and 9. Oliktok Point Figure 6: Backwards trajectories of cloudy air masses originating at Barrow, Alaska for Oct. 6 (left) and Oct. 9 (right). The red, blue, and green lines on Oct. 6 represent the first cloud layer, second cloud layer, and above the second cloud layer, respectively. For Oct. 9 they represent below, in, and above the single cloud layer. Figure 8: Vertical profiles of liquid water content on Oct. 6 and 9. Summary: In-situ cloud microphysical data have been analyzed to estimate the horizontal variability within an individual cloud field. The analysis uses the autocovariance function of a time series of data to derive the spatial distribution of variance. An analysis of data collected on October 9 shows two distinct scales of approximately 5 and 12 km. These scales may be the result of the mesoscale rolls in the clouds, as seen in fig. (2). Observations suggest the horizontal variability changed from day to day. Figure 7 shows the variability in liquid water path on October 6 is smaller and at shorter scales than the variability on October 9. A trajectory analysis using the NOAA HYSPLIT model was performed to determine any relation between the day to day variation in macrophysical parameters. The main differences in air mass trajectories between October 6 and 9 were whether the parcels traveled over land or water and the amount of synoptic scale, vertical displacement of the parcels. These may have been responsible for the variation in properties that affected the distribution of cloud macrophysical properties, such as liquid water path. Figure 7 shows a scale of variability of liquid water path on October 9 that is much larger than the scales of variability estimated from the horizontal scale analysis. This suggests there are influences on the variability of liquid water path other than the variability in microphysical properties. Figure 3: Time series of aircraft altitude during sample interval on October 9. Blue lines are approximate cloud boundaries. Figure 2: MODIS image of cloud field over the North Slope of Alaska on October 9. Yellow line is aircraft flight path. Figure 1: Time series of liquid water content taken during level leg on October 9. Figure 4: Time series of FSSP droplet concentration during sample interval on October 9. 5.4 km 12.3 km References: Draxler, R. R., and G. D. Hess, 1998, An Overview of the HYSPLIT-4 Modelling System For Trajectories, Dispersion, and Deposition. http://www.arl.noaa.gov/ready/hysplit4.html Jenkins, G. M., and D. Watts, 1968: Spectral Analysis and Its Applications. Holden-Day, 217 Verlinde, et al., 2007, The Mixed-Phase Arctic Cloud Experiment. Bull. Amer. Meteor. Soc., 2, 205-221. Figure 5: Autocovariance function of droplet concentration time series (Fig. (4)). Figure 6: Power spectrum derived from droplet concentration ACVF (Fig (5)). Acknowledgements: This research has been supported by DOE Grant No. DE-FG02-06ER64168. Horizontal Variability In Microphysical Properties of Mixed-Phase Arctic Clouds David Brown, Michael Poellot – University of North Dakota HYSPLIT Trajectory Analysis: Clouds are strong modulators of the radiative budget in the Arctic. Their influence depends in part on microphysical properties such as particle size, liquid water path and particle phase. A good knowledge of the spatial and temporal variability of these properties is necessary for accurate model parameterizations. Data from the 2004 Mixed-Phase Arctic Cloud Experiment (M-PACE) have been analyzed to provide a quantitative estimate of the horizontal scale of the variability in microphysical cloud properties within individual cloud fields. A trajectory analysis has also been performed to relate air parcel trajectories to changes in horizontal variability of cloud properties from day to day during the experiment. Horizontal Scale Analysis: • Methodology: • Fourier analysis of in-situ cloud microphysical data • Determine scales of greatest variability • Challenges: • Level leg samples not long enough to resolve large scales • Must use time series of ramped ascents and descents, contain intervals of no cloud data • Calculate autocovariance function of time series and use to derive power spectrum (Jenkins and Watts 1968) • Can only perform analysis on parameters that do not vary with height (number concentration) • Sampling Profiles: • Trajectory analysis using NOAA HYSPLIT model performed for flight cases during second synoptic regime of M-PACE (Draxler and Hess 1998) • Regime consisted of building high pressure over ice pack northeast of Alaska coast (Verlinde, et al. 2007) • Associated northeast flow with considerable fetch along Arctic Ocean • Oct. 4 – 8 scattered, thin, multi-layer clouds, Oct. 9 – 15 single layer stratus • Observations show less liquid water, more ice in Oct. 4 – 8 clouds • Figures 7 and 8 shows significant variation in spatial structure of cloud properties during regime • HYSPLIT analysis shown in fig. (6) shows significant differences in trajectories on Oct. 6 and 9 • Oct. 6: Trajectories’ paths mostly over land, synoptic scale upward motion • Oct. 9: Trajectories’ paths over ocean, synoptic scale subsidence • Differences in trajectories may influence parameters that affect spatial structure of cloud properties • Assumptions: • Constant true airspeed of 80 m s-1 • Variability is in horizontal direction • Vertical displacement is negligible relative to horizontal • Data: • October 9, 2004 • FSSP Total Droplet Concentration • Time series of ramped ascents and descents • 76096 – 78542 s.f.m. UTC • 2447 s, 195.76 km • Results: