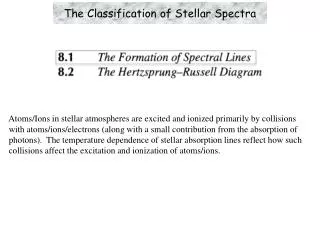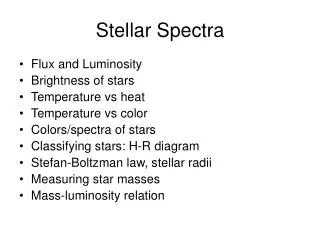
Stellar Spectra
Stellar Spectra. Caroline Fletcher. Spectroscopy. The process of dispersion of an object's light into its component colors. Dispersion is the spatial separation of a white light into components of different wavelengths (different colors)

Stellar Spectra
E N D
Presentation Transcript
Stellar Spectra Caroline Fletcher
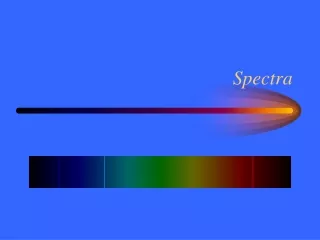
Spectroscopy • The process of dispersion of an object's light into its component colors. • Dispersion is the spatial separation of a white light into components of different wavelengths (different colors) • Originally the study of the interaction between radiation and matter as a function of wavelength (λ). • Physicists classify light waves by their energies (wavelengths). Labeled in increasing energy, we might draw the entire electromagnetic spectrum as shown in the figure below: http://lectureonline.cl.msu.edu/~mmp/applist/Spectrum/s.htm
History • 1814 Joseph Frauenhofer, an optician in Munich, discovered many dark lines crossing the spectrum of the Sun. • In 1814, Fraunhofer invented the spectroscope. • This instrument is used to measure the properties of light. • These are usually used to conduct a spectral analysis to identify materials. • A Spectroscope works by breaking light into the different wavelengths. • Spectroscopes are made of prisms, as light passes through the glass, the different wavelengths slow down by different amounts and are bent into their colors.
1910 Annie Jump Cannon and others working at Harvard developed an empirical scheme for classifying the spectra.
1930s Cecilia Payne-Gaposchkin applied quantum mechanical calculations to stellar spectrum and demonstrated the importance of temperature to the appearance of a spectrum and showed that stars are almost entirely H. • She became the first woman to become a full professor at Harvard.
http://www.classzone.com/books/earth_science/terc/content/visualizations/es2601/es2601page01.cfm?chapter_no=visualizationhttp://www.classzone.com/books/earth_science/terc/content/visualizations/es2601/es2601page01.cfm?chapter_no=visualization Stellar Spectra • Spectral lines are formed in the photosphere of a star so we must understand the structure of a photosphere:
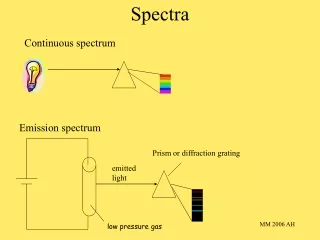
Continuous Spectrum • A spectrum in which all wavelengths are present between certain limits. • It is produced by electrons undergoing free bound- transitions in a hot gas. • Free bound- transition is the emission of radiation when a free electron (not attached to an atom) is captured by an ion. • The recombination may be to an excited energy level, with the emission of a photon, after which the electron cascades down through the excited states to the ground state, producing emission lines characteristic of that ion or atom.
Rainbows • How do they form? • Caused by drops of water falling through the air. • This creates a natural continuous spectrum. • Why are they bent, and always in the same order? • Roy G. Biv (Red, Orange, Yellow, Green, Blue, Indigo, and Violet. • The light exits the raindrop at a 40-42 degree angle away from the angle it entered the raindrop. • The violets and blues bend at a 40 degree angle, and the oranges and reds bend at a 42 degree angle. • This is due to the light being bent as it enters and then again when it exits the water drop.
Emission Spectra • Each element's emission spectrum is unique. • Spectroscopy can be used to identify the elements in matter of unknown composition. Similarly, the emission spectra of molecules can be used in chemical analysis of substances. • The emission spectrum characteristics of some elements are plainly visible to the naked eye when these elements are heated. For example, when platinum wire is dipped into a strontium nitrate solution and then inserted into a flame, the strontium atoms emit a red color. Similarly, when copper is inserted into a flame, the flame becomes green.
Absorption Spectrum • Over 100,000 absorption lines are visible in the Sun's spectrum. • Stars have absorption line spectra. • We can think of stars as a hot continuum source with a "cool" atmosphere of absorbing gas. • The chemical make-up of the stellar atmosphere determines the wavelengths that get absorbed. Dark hydrogen absorption lines appear against a continuous visual spectrum, the light in the spectrum absorbed by intervening hydrogen atoms. From "Astronomy! A Brief Edition," J. B. Kaler, Addison-Wesley, 1997.
Stellar spectral sequence • The appearances of the spectra of stars is dependent on the temperature of the star.
Is that star moving? • Shifts in the lines will show astronomers the movement of distant stars. • A red shift means that it is moving away, while a blue/violet shift means that it is moving toward us. http://www.classzone.com/books/earth_science/terc/content/visualizations/es2802/es2802page01.cfm
Work Cited • http://ircamera.as.arizona.edu/astr_250/Lectures/Lecture_14.htm • http://eosweb.larc.nasa.gov/EDDOCS/Wavelengths_for_Colors.html • http://www.astr.ua.edu/4000WS/GAPOSCHKIN.html • http://www.astro.umd.edu • http://www.classzone.com/books/earth_science/terc/navigation/visualization.cfm