Download
1 / 34
380 likes | 723 Vues
The Classification of Stellar Spectra. The Formation of Spectral Lines The Hertzsprung-Russell Diagram. Midterm Exam. Midterm Thursday February 21 (chapters 1-6) A review session will be held during the regularly scheduled lecture time on Tuesday February 19. Stellar Spectra.

E N D
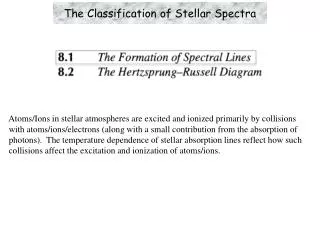
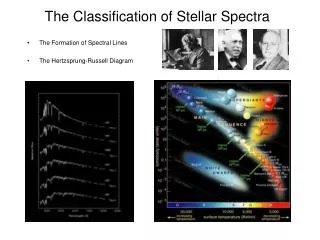
The Classification of Stellar Spectra • The Formation of Spectral Lines • The Hertzsprung-Russell Diagram
Midterm Exam Midterm Thursday February 21 (chapters 1-6) A review session will be held during the regularly scheduled lecture time on Tuesday February 19.
Stellar Spectra The spectra of stars contain much information about the properties of stars….What can be learned? First need to observe…Then classify/categorize
The Spectral Types of Stars • “Spectral Taxonomy” • Temperature Sequence • OBAFGKM-LT • 10 Subdivisions • A0-A9,B0-B9 • Annie Jump Cannon classified some 200,000 spectra between 1911-1914,Results collected into the Henry Draper Catalogue (Betelgeuse = HD39801)
Stellar Spectral Classification What is the source of the underlying order??? Atomic Physics
Spectral Lines • Balmer lines are associated with electronic transitions in Hydrogen atom’s first excited state n=2. Balmer lines reach their maximum “intensity” in the spectra of A0 stars with T=9250 K • Neutral Helium lines are strongest for B2 stars with T=22,000K • Singly ionized calcium are most intense for K0 stars with T=5250 K • Another fine astronomical convention: METAL is any element heavier than helium!!!!!!
Understanding Spectral Lines Need to understand… • The atom • Statistical Mechanics First excited state occupancy for hydrogen atom from Boltzmann Equation Atomic Transitions Boltzmann Energy Distribution Saha Ionization Equation
Stellar Spectral Lines • Why do spectral lines depend upon temperature? • Populations of various atomic states depends upon temperature • Degeneracy of levels • Stage of Ionization • Depends on Pressure and density… • Depends somewhat on composition of star as well
Maxwell-Boltzmann Velocity Distribution • http://www.chm.davidson.edu/chemistryapplets/KineticMolecularTheory/Maxwell.html The root-mean-squared is the square root of the average value of v2
Maxwell-Boltzmann Velocity Distribution Example 8.1.1 Determine the fraction of hydrogen atoms in a gas at T=10,000 K with speeds between v1 and v2
The Boltzmann Equation The probability distribution of a system occupying a given energy state may be described by the Boltzmann Factor… T=85,000K n2=n1….for Hydrogen atom But what about Ionization? http://hyperphysics.phy-astr.gsu.edu/hbase/quantum/disfcn.html#c3
The Boltzmann Equation Example 8.1.3 At what temperature does N2=N1 for hydrogen ??? Boltzmann Equation Degeneracy of levels But… Balmer lines reach maximum intensity at T~9520K!! What gives?
The Saha Equation • Ionization levels depend on: • Temperature • Density/Pressure • Ionization Energy from given level • Degeneracy of levels • Saha Equation (links) • http://en.wikipedia.org/wiki/Saha_equation • http://www.aoc.nrao.edu/~smyers/courses/astro12/L9.html • http://www.ifa.hawaii.edu/users/kud/teaching/6.Stellar_spectra.pdf
Number of Excited Hydrogen Atoms • Convolution of Boltzmann and Saha Equations • Maximum occurs at 9500K due to lack of un-ionized atoms above this temperature
EXAMPLE 8.1.4 ACTUAL INTENSITY CURVE BOLTZMANN X SAHA X
Dependence of Spectral Lines vs. Temperature Line Strength for each element (and ionization level) depends upon temperature as shown above….
Hertzsprung-Russell diagram • Astronomers started to notice that O stars tended to be brighter and hotter than the other stars. • With the Mass-Luminosity relation it was noted that O stars were more massive as well • This led to a theory of stellar evolution that stated that stars began their lives as O stars and as they age became cooler,dimmer and less massive…This theory is no longer accepted… • http://www.mhhe.com/physsci/astronomy/applets/Hr/frame.html
Hertzsprung-Russell diagram • Ejnar Hertzsprung (1873-1967) Danish Engineer and amateur astronomer • 1905 publication confirming correlation between luminosity and spectral type • Noticed that type G and later stars could have a range of luminosities…The brighter stars of these classes were GIANTS in order to achieve their brightness at the lower flux at lower temperatures
Hertzsprung-Russell diagram • Henry Norris Russell independently came to the same conclusions as Hertzsprung …but made a graph!!!! The Hertzsprung-Russell Diagram
H-R diagram • Many more stars plotted today…!!!
H-R diagram • Categories • Main Sequence • “Adult” • Stable • Hydrogen core burning • Supergiants • 1000x bigger than Sun • Unstable (Betelgeuse 2070 day period 700-1000 x Rsun) • Giants • White Dwarfs • Example 8.2.1
Morgan-Keenan Luminosity classes • Subtle variations in the line widths of spectra can be found for stars with similar effective temperatures but differing luminosities…canbe used for classification
Spectroscopic Parallax • Can use H-R diagram to estimate absolute brightness of star given its spectral type • Use apparent brightness and distance modulus formula • To obtain distance • Scatter of +/- 1 magnitude results in factor of 1.6 uncertainty in distance