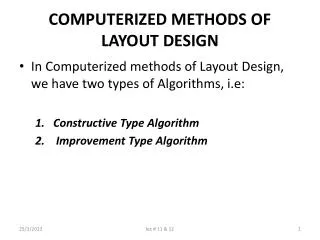
COMPUTERIZED RELATIONSHIP LAYOUT PLANNING (CORELAP)
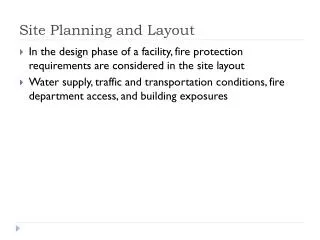
COMPUTERIZED RELATIONSHIP LAYOUT PLANNING (CORELAP). CORELAP constructs layouts by locating rectangular shaped departments The relationship chart provides the basis for the order in which different departments are placed The input requirements of CORELAP consists of:

COMPUTERIZED RELATIONSHIP LAYOUT PLANNING (CORELAP)
E N D
Presentation Transcript
COMPUTERIZED RELATIONSHIP LAYOUT PLANNING (CORELAP) • CORELAP constructs layouts by locating rectangular shaped departments • The relationship chart provides the basis for the order in which different departments are placed • The input requirements of CORELAP consists of: • Relationship chart with weights for the depts • Number & area of departments cllec#15 & 16
COMPUTERIZED RELATIONSHIP LAYOUT PLANNING (CORELAP) The Procedure adopted for using CORELAP: • Defining input data • Determination of placement sequence • Designing of layout • Calculating the total score of layout cllec#15 & 16
CORELAP: ILLUSTRATIVE Example Example#3: Develop a layout for the following problem, area of departments & scale are shown in table 3.1 Table.3.1 cllec#15 & 16
CORELAP: ILLUSTRATIVE Example Solution: Assume 1 unit square = 600 sq.ft In order to find out the placement sequence, the relationship chart is given as table 3.2 Table: 3.2. Relationship chart cllec#15 & 16
CORELAP: ILLUSTRATIVE Example Definition of Relationship along with value cllec#15 & 16
CORELAP: ILLUSTRATIVE Example • Such relationship chart is used to compute total closeness rating (TCR) for all the departments, how to find TCR, such calculation is shown in table:3.3 • Table:3.3 TCR calculations cllec#15 & 16
CORELAP: ILLUSTRATIVE Example • The following steps should be carried out to select placement sequence of departments: Step 1: Select the highest TCR value (23) which is for the dept.no.5 Step 2: Now select the dept having the highest closeness rating with dept.no.5. closeness with dept 5 has the highest value, 6 which corresponds to A. In case of a tie, select dept having the higher TCR value cllec#15 & 16
CORELAP: ILLUSTRATIVE Example Step 3: Repeat Step 2 on the unassigned depts • Now placement sequence is 5,6,7,2,1,4,3. • The following steps are to be carried out for the formation of the layout Step 1: the first department of the placement sequence, dept no 5 is placed at the centre of the layout (1 square) Step 2: The second dept is placed adjacent to the first one in fig3.4 cllec#15 & 16
CORELAP: ILLUSTRATIVE Example Step 3: Now according to the sequence, dept no 7 has to be placed. But there can be many combinations. To find the best alternative we find, Placement Rating (PR) as shown in table 3.5 cllec#15 & 16
CORELAP: ILLUSTRATIVE Example Step 4: Step 3 is repeated to obtain the whole layout the final layout is shown in fig3.5 • The total score of the layout is calculated using the relation given below Total score = ∑(closeness rating x length of the shortest path) • If two departments are adjacent, they will have a common border. The path length will be zero. • The calculation of the score for combinations of departments are shown in table 3.6 • Since we aim at minimizing the layout score, we can repeat the procedure by changing area of unit square cllec#15 & 16