Causal Models for Regression Modeling Strategies
Causal Models for Regression Modeling Strategies. Drew Griffin Levy May, 2019. Takeaways : Reasons to consider causal models for regression modeling in observational studies. Alternative approaches to variable selection

Causal Models for Regression Modeling Strategies
E N D
Presentation Transcript
Causal Models for Regression Modeling Strategies Drew Griffin Levy May, 2019
Takeaways: Reasons to consider causal models for regression modeling in observational studies • Alternative approaches to variable selection • Deeper insight re. how causal inferences from associational models can be questionable • Identifying the minimum (and various) set of adjustments necessary for unbiased estimation of effects • Risk of inducing bias with statistical adjustment (collider stratification bias) • Clearly and explicitly communicating assumptions about justifications for model specification
We can & will be fooled by data! • It is a prevalent mistake to believe that “all the answers [information] are in the data” • Observations are not objective; Nature is indifferent to furnishing noise vs. signal; the computer cannot divine causes; good faith science requires humility • Relying on statistical approaches to identifying variables for adjustment and control of confounding can be problematic
Alternative PoV: how to identify variables for unbiased estimation • How to estimate a 1° effect (e.g., Tx) without bias. • Confounding is a causal phenomenon • Confounding: P(Y|X) ≠ P(Y|do(X)) • Causal models also elucidate • Adjustments that induce bias! • Selection bias • Much else • Identifying the set(s) of adjustments necessary for unbiased estimation of specific effects
“What causes say about data” • Causal diagrams show how causal relations are expected to translate into associations & independencies • The associations & independencies posited are derived from subject matter knowledge • With data you can compute the associations & independencies observed • The causal model will be reconciled with the observed pattern of associations & independencies
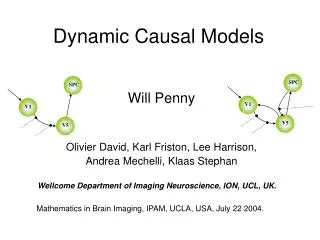
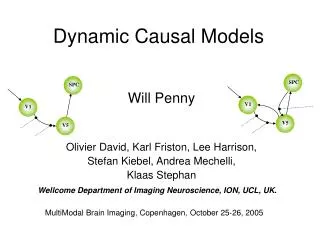
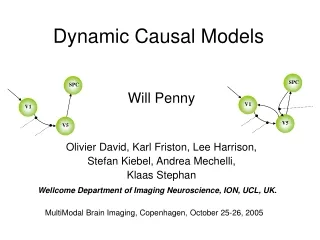
Basic structures in causal models • Causal relationship • Chains • Mediation • Confounder • Collider
Cause-effect DAGs are both causal models and statistical models (i.e., models that represent associations and independencies) Lack of causal effects imply independencies: e.g., P(Y|X) ≠ P(Y) Causal effects imply associations
Causal structures: Chains, Junctions and Paths • Mediation • Direct vs. indirect effects • Total effect • Conditional independence: • In general: Pr(Y=y|X=x) = Pr(Y=y) • Pr(Y=y|A=a, B=b) = Pr(Y=y|B=b)
Confounders • Causal structure with common causes • Bias: A and Y are not expected to be independent • Bias: estimation of magnitude of association of A and Y
Colliders & Collider-stratification bias • Paths with convergent arrows • When colliders are not conditioned on they block pathways. • When colliders are conditioned on they open pathways • Thus adjustment can inadvertently induce bias! • The prevalence of these collider structures is likely under appreciated.
Stratifying on a collider is a major culprit in systematic bias
Selection Bias and collider-stratification bias • Common effects do not create an association, unless conditioned on. • When there is a component of the association due to selecting a subset of the population, we say that there is selection bias.
Deconfounding → P(Y|do(X)) • Distinguish concepts: confounding, confounder, and “deconfounding” • “d-separation”: for any given pattern of paths in the causal model, what pattern of dependencies and independencies we should expect in the data • “Back-door criterion” for bias evaluation indicates possible sets of variables for unbiased estimation • Identify the set of adjustments necessary for unbiased estimation of effects
Daggity: - drawing and analyzing causal diagrams (DAGs) (www.dagitty.net/) Staplin N, Herrington WG, Judge PK, Reith CA, Haynes R, Landray MJ, Baigent C, Emberson J. Use of Causal Diagrams to Inform the Design and Interpretation of Observational Studies: An Example from the Study of Heart and Renal Protection (SHARP). Clin J Am
“Draw your assumptions before your conclusions.” —M. Hernan • Causal diagrams help us summarize what we know about a problem and communicate our assumptions about its causal structure. • Causal diagrams help us diagnose biases in causal inference • Causal diagrams help you organize your expert knowledge visually; and therefore, they help you draw your assumptions before your conclusions.
Resources • DAGitty - drawing and analyzing causal diagrams (DAGs) (www.dagitty.net/) • Judea Pearl • Causal Inference in Statistics: A Primer, 2016 • Causality: Models, Reasoning and Inference, 2009 • The Book of Why: The New Science of Cause and Effect, 2018. • Miguel Hernan • Causal Inference Book • edX MOOC: Causal Diagrams: Draw Your Assumptions Before Your Conclusions • Modern Epidemiology, 3rd Ed. Rothman, Greenland, Lash: Chapter 12–Causal Diagrams • Causal Diagrams for Epidemiologic Research. S. Greenland, J. Pearl, J. Robins. Epidemiology 1999;10:37-48. • Catalogue of Bias, Oxford University
Proposed process for using SCMs and DAGs • Think hard about the research question and problem of effect identification • Develop DAGs based on subject matter knowledge without looking at data: do not contort the DAG based on data availability • Do the causal calculus in Daggity to identify the set of minimum necessary adjustment meant for unbiased effect estimation • Do analysis and reconcile observations with causal model (this is science) • Publish the DAG with the research report.
Takeaways: Reasons to consider causal models for regression modeling in non-randomized studies • Better approaches to variable selection • Deeper insight re. how causal inferences from associational models can be questionable • Identifying the minimum set of adjustments necessary for unbiased (unconfounded) estimation of effects • Risk of collider stratification bias • Clearly and explicitly communicating assumptions about justifications for model specification.